Pobierz prezentację
Pobieranie prezentacji. Proszę czekać

11
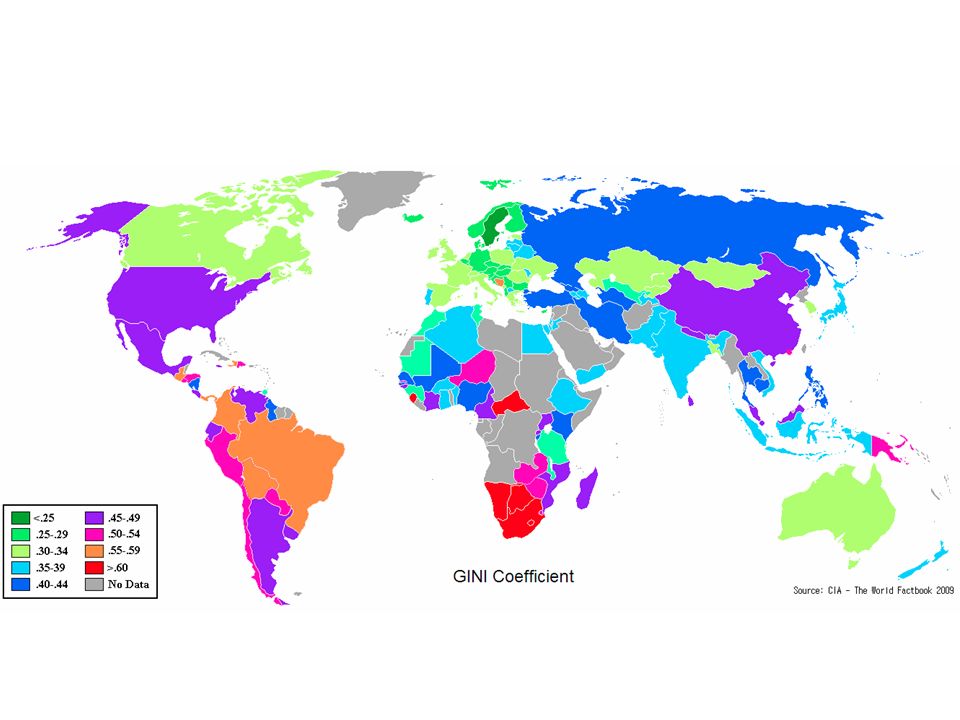
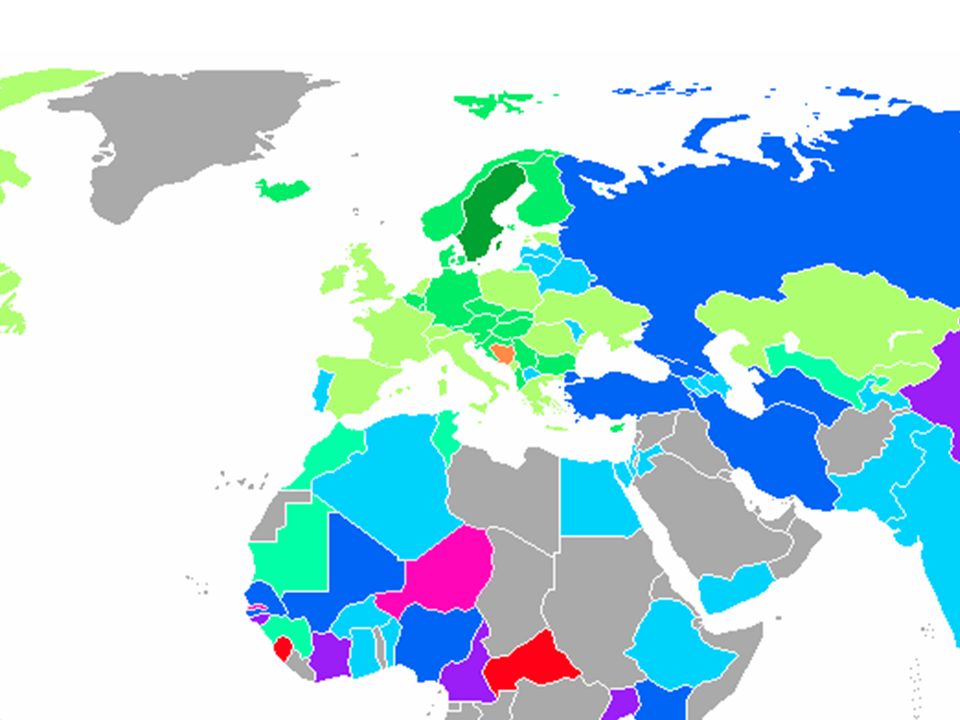
Gini index measures the extent to which the distribution of income (or, in some cases, consumption expenditure) among individuals or households within an economy deviates from a perfectly equal distribution. Gini index of 0 represents perfect equality, while an index of 100 implies perfect inequality.

12
Gini coefficient

17
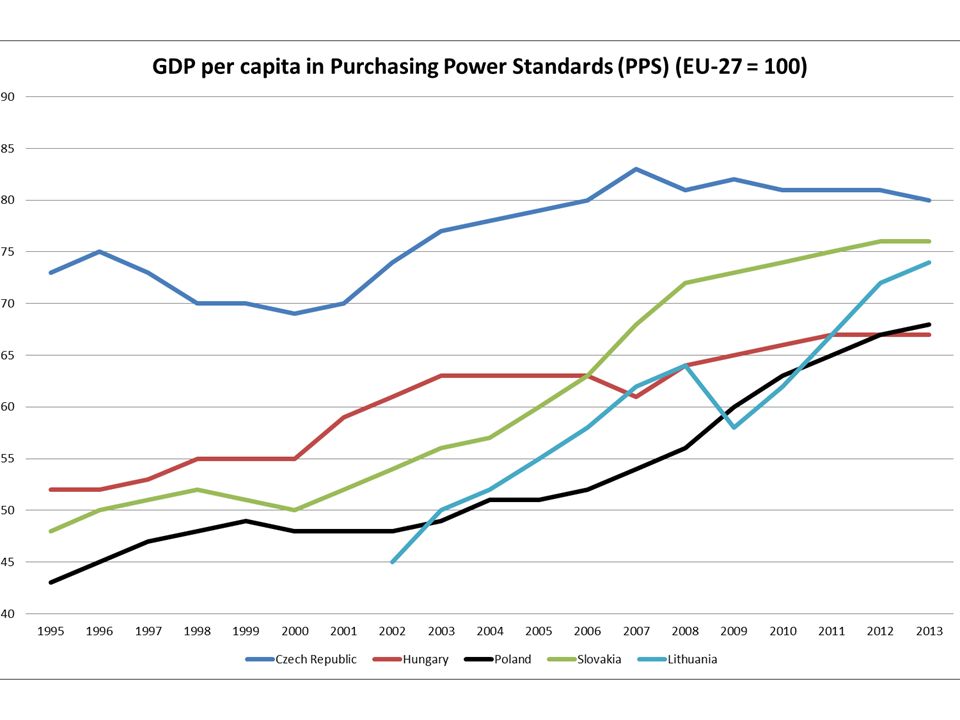
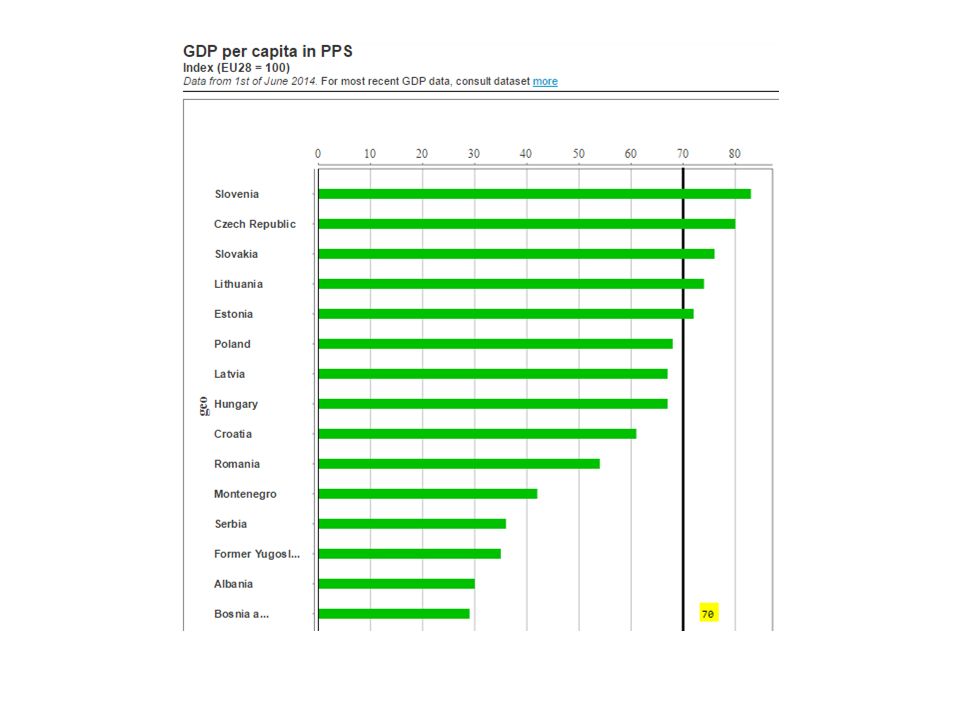
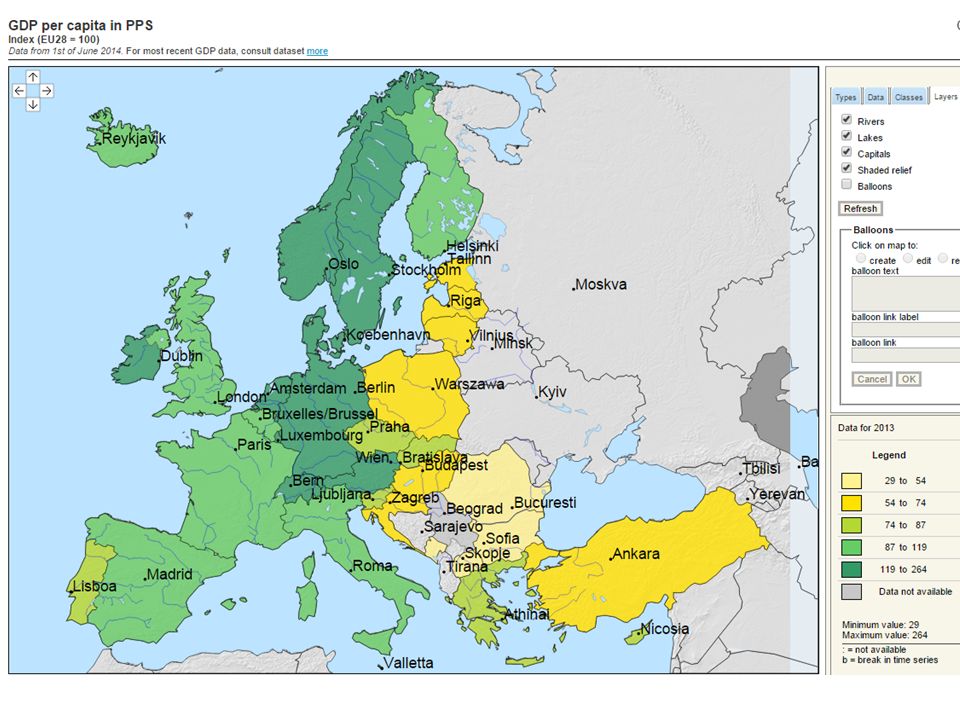
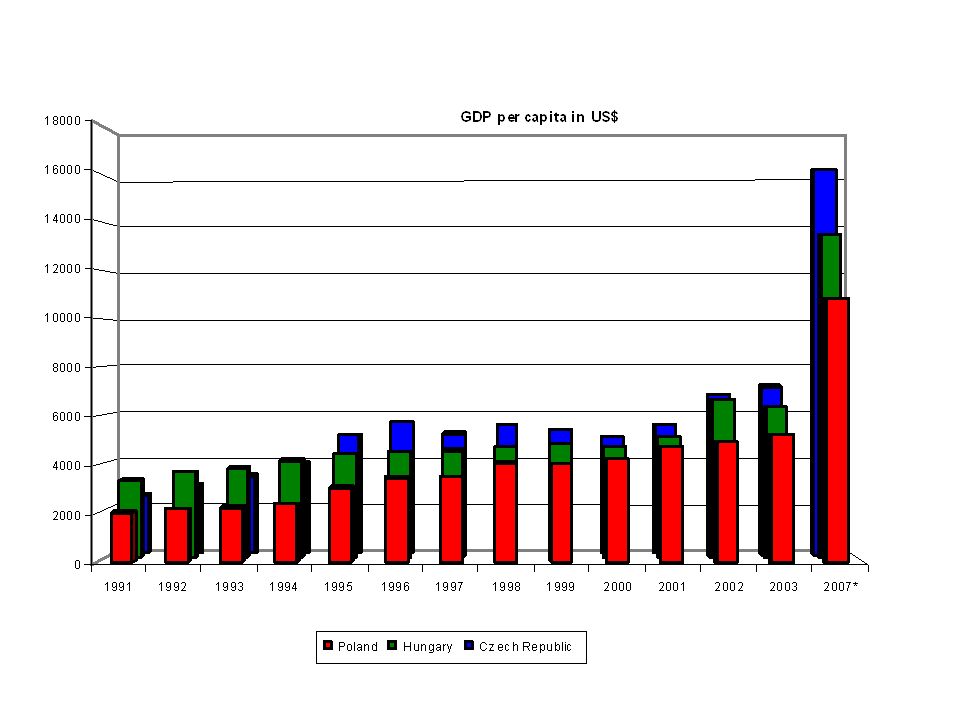
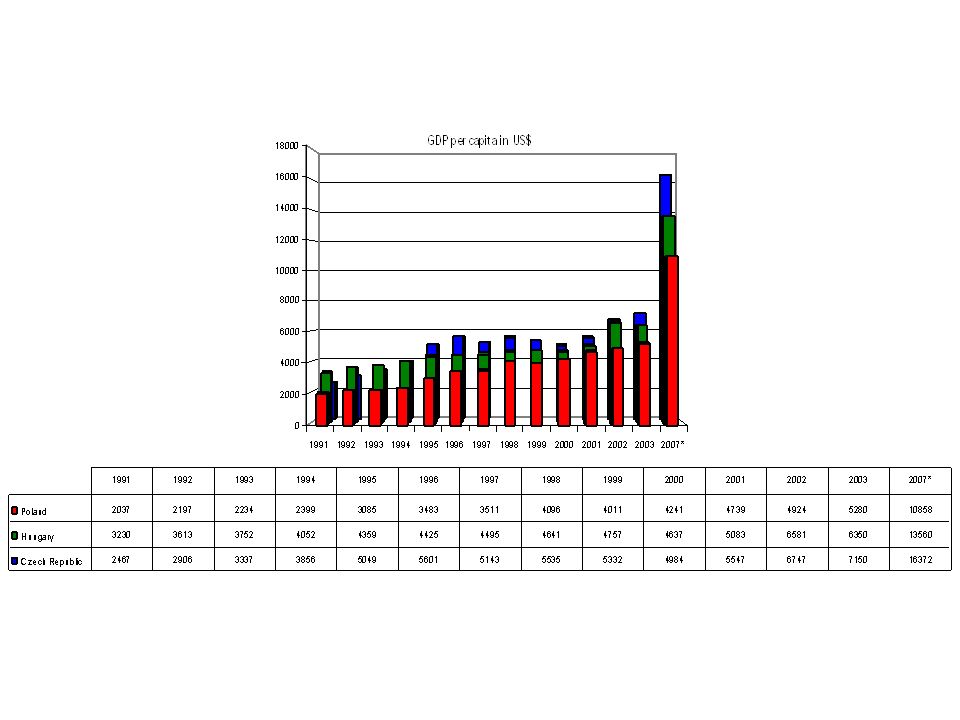
GDP per capita in Purchasing Power Standards - PPS (EU-27 = 100) Gross domestic product (GDP) is a measure for the economic activity. It is defined as the value of all goods and services produced less the value of any goods or services used in their creation. The volume index of GDP per capita in Purchasing Power Standards (PPS) is expressed in relation to the European Union (EU-27) average set to equal 100. If the index of a country is higher than 100, thGross domestic product (GDP) is a measure for the economic activity. It is defined as the value of all goods and services produced less the value of any goods or services used in their creation. The volume index of GDP per capita in Purchasing Power Standards (PPS) is expressed in relation to the European Union (EU-27) average set to equal 100. If the index of a country is higher than 100, this country's level of GDP per head is higher than the EU average and vice versa. Basic figures are expressed in PPS, i.e. a common currency that eliminates the differences in price levels between countries allowing meaningful volume comparisons of GDP between countries. Please note that the index, calculated from PPS figures and expressed with respect to EU27 = 100, is intended for cross-country comparisons rather than for temporal comparisons.is country's level of GDP per head is higher than the EU average and vice versa. Basic figures are expressed in PPS, i.e. a common currency that eliminates the differences in price levels between countries allowing meaningful volume comparisons of GDP between countries. Please note that the index, calculated from PPS figures and expressed with respect to EU27 = 100, is intended for cross-country comparisons rather than for temporal comparisons.
 is expressed in relation to the European Union (EU-27) average set to equal 100. If the index of a country is higher than 100, thGross domestic product (GDP) is a measure for the economic activity. It is defined as the value of all goods and services produced less the value of any goods or services used in their creation. The volume index of GDP per capita in Purchasing Power Standards (PPS) is expressed in relation to the European Union (EU-27) average set to equal 100. If the index of a country is higher than 100, this country s level of GDP per head is higher than the EU average and vice versa. Basic figures are expressed in PPS, i.e. a common currency that eliminates the differences in price levels between countries allowing meaningful volume comparisons of GDP between countries. Please note that the index, calculated from PPS figures and expressed with respect to EU27 = 100, is intended for cross-country comparisons rather than for temporal comparisons.is country s level of GDP per head is higher than the EU average and vice versa. Basic figures are expressed in PPS, i.e. a common currency that eliminates the differences in price levels between countries allowing meaningful volume comparisons of GDP between countries. Please note that the index, calculated from PPS figures and expressed with respect to EU27 = 100, is intended for cross-country comparisons rather than for temporal comparisons..")
35
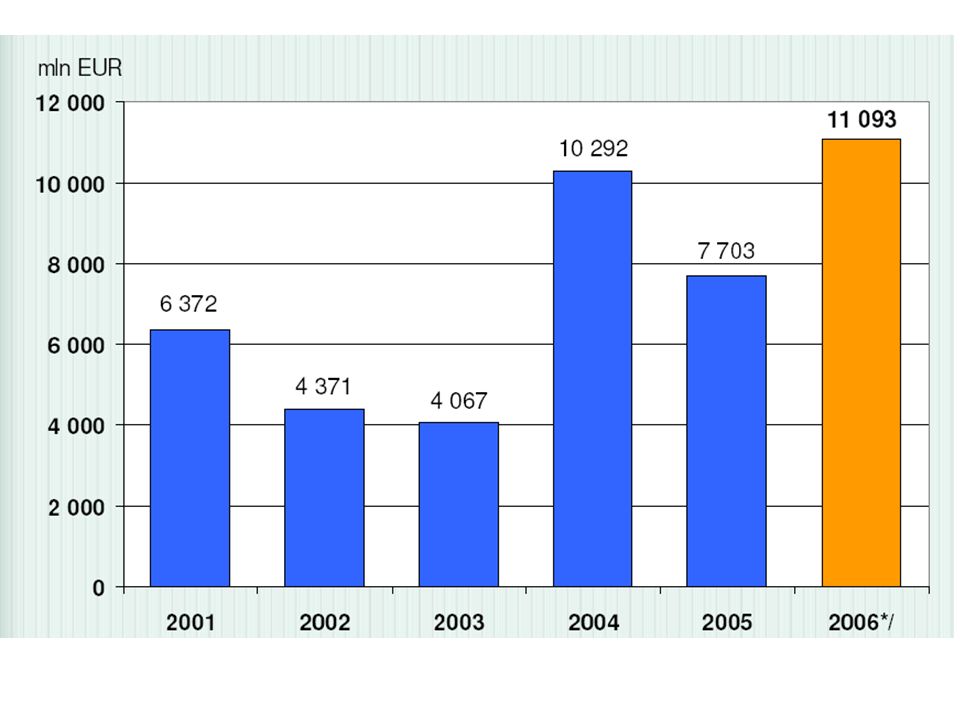
Inflow of FDI 2006

36
Pomysły i literatura Notatki w j. ang. Monika Bąk – Europa Środkowa i Wschodnia wobec wyzwania transformacyjnego – zarys tradycyjnej analizy transformacji gospodarczej według triady elementów przemian str. 65 i nast. Ewentualnie odpowiedni rozdział z Joosta’a Winiarski ??? Rozbić ten temat na 3 części ??? (Shock Therapy vs Gradual Reforms ??? + Privatization) Źródła recesji transformacyjnej. Poziomy inflacji w Europie środkowej w 1989 ??? Problem zadłużenia zagranicznego w Europie Środkowej u progu transformacji, ??? Udział sektora publicznego w tworzeniu PKB w 1989 i następnych latach Struktura PKB (sektory: rolnictwo, przemysł, usługi) w 1989 i następnych latach. Indeks GINI Grafy 4 elementowe (bezrobocie, inwestycje, PKB per capita, inflacja lub przeciętna długość życia) Bąk s. 266 Dodatkowe wykresy na podstawie Bąk Słabość państwa w okresie transformacji Rola NATO i UE w ułatwianiu transformacji gospodarczej. Dopisać Joosta do Syllabusa Przygotować pytania na seminarium dla studentów ;P
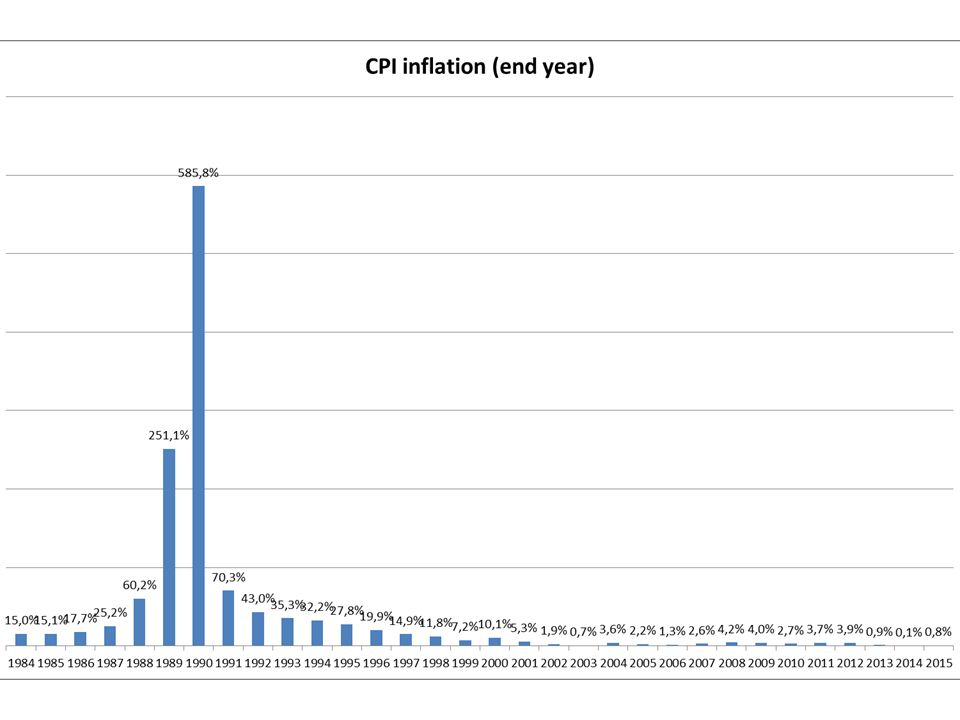
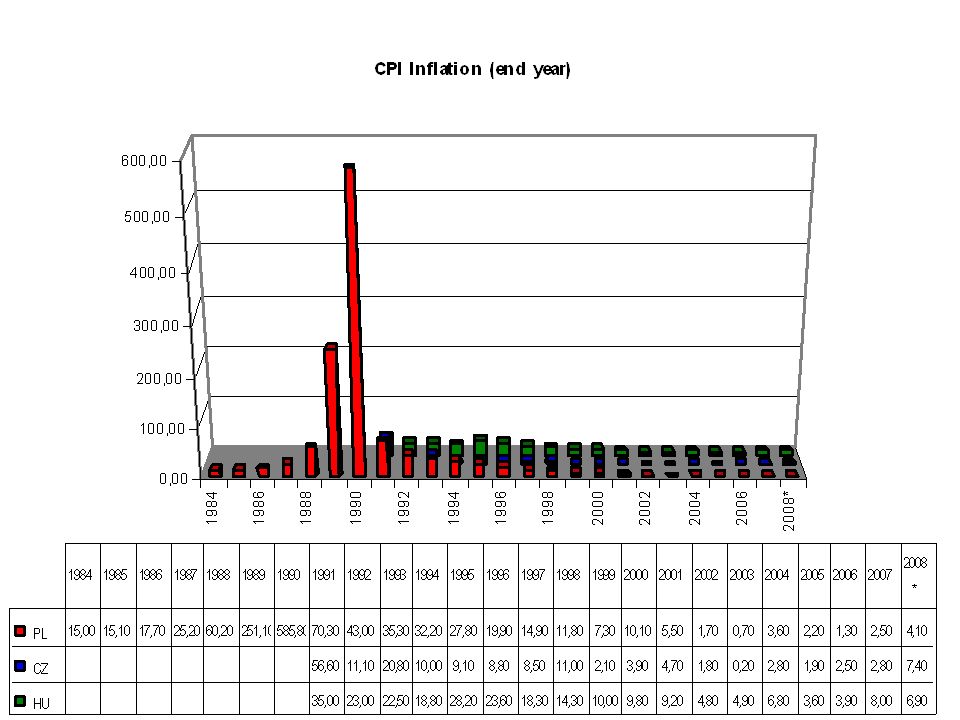
 Źródła recesji transformacyjnej. Poziomy inflacji w Europie środkowej w Problem zadłużenia zagranicznego w Europie Środkowej u progu transformacji, . Udział sektora publicznego w tworzeniu PKB w 1989 i następnych latach Struktura PKB (sektory: rolnictwo, przemysł, usługi) w 1989 i następnych latach. Indeks GINI Grafy 4 elementowe (bezrobocie, inwestycje, PKB per capita, inflacja lub przeciętna długość życia) Bąk s. 266 Dodatkowe wykresy na podstawie Bąk Słabość państwa w okresie transformacji Rola NATO i UE w ułatwianiu transformacji gospodarczej. Dopisać Joosta do Syllabusa Przygotować pytania na seminarium dla studentów ;P.")
Podobne prezentacje