Pobierz prezentację
Pobieranie prezentacji. Proszę czekać

1
Systemy detekcji intruzów
Maciej Miłostan

2
Agenda Trochę teorii Analiza i korelacja danych
Trochę teorii Co to jest IDS? Włamania i ataki Systemy IDS a IPS Specyfikacja CIDF i tym podobne Analiza i korelacja danych Snort – de facto standard Wizualizacje i raporty Aplikacje zarządzające Podsumowanie Ogólny outline prezentacji. Co zostanie zasygnalizowane w prezentacji

3
Hmm, tu się dzieje coś niedobrego!!!
Co to jest IDS? Hmm, tu się dzieje coś niedobrego!!! Detekcja zagrożeń Alarmy - “Hej, coś jest nie tak!” Monitorowanie - sondy Mechanizmy reakcji na zdarzenia Systemy detekcji intruzów = prosta idea

4
Idea a praktyka Włamanie, próba włamania,... czy zwykła aktywność
Metody włamań Luki w systemach Aktualność reguł systemu IDS Rozciągnięcie sekwencji działań w czasie, rozdzielenie na wiele sesji Ataki typu DRDoS Co jest włamaniem lub jego proba, a co nie? Jakie są metody włamań? Jakie luki występują w systemach? Czy wiedza systemu IDS jest aktualna? Czy system może działać w pełni automatycznie? Sekwencja działań może być rozciągnięta w czasie Sekwencja działań może być rozbita pomiędzy różne sesje Poprawnie działający system może być wykorzystany do ataku na inny system (np. DRDoS)
")
5
Włamania i ataki Włamanie: Włamanie jest skutkiem ataku
ciąg współzależnych działań zagrożenie naruszenia bezpieczeństwa zasobów nieautoryzowany dostęp do danej domeny komputerowej lub sieciowej Włamanie jest skutkiem ataku Włamanie jest ciągiem współzależnych działań złośliwego intruza, które powodują wystąpienie zagrożeń naruszenia bezpieczeństwa zasobów przez dostęp nieautoryzowany do danej domeny komputerowej lub sieciowej

6
Model ataku Metoda Inicjator ataku Cel Nieformalny model ataku.
-Metoda ataku -Inicjator ataku -Cel ataku W niektórych przypadkach włamywacz oraz cel ataku pokrywają się ze sobą. W przypadkach tych włamywacz uzyskuje wcześniej dostęp do węzłów stanowiących cel ataku. Włamywacz jak i jego cel mogą być reprezentowane jako pojedynczy węzeł sieci lub grupa węzłów stanowiąca całą podsieć. Można przyjąć, że wyeliminowanie jednego z elementów zabezpiecza przed atakiem praktyce jednak wyeliminowanie celu ataku jest zazwyczaj niemożliwe. Stosowane jest rozwiązanie , w którym usunięcie celu ataku realizuje się przez translację adresów sieci wewnętrznej albo poprzez blokowanie dostępu do konkretnych węzłów za pośrednictwem zapór sieciowych. W przypadku gdy nie ma możliwości wyeliminowania celu ataku skoncentrować należy się na wyeliminowaniu włamywacza lub metody ataku. To zadanie wykracza poza możliwości współczesnych mechanizmów zabezpieczeń, gdyż działanie tych narzędzi obejmuje jedynie cele ataku i pokrywa tylko skończoną liczbę metod ataku. Jest to pasywne zachowanie względem atakującego. Należy zastosować podejście kompleksowe w ramach, którego tradycyjne mechanizmy uzupełnione zostaną o mechanizmy dodatkowe, których zadaniem będzie: Wykrywanie włamań, Śledzenie atakującego, Analiza przebiegu incydentu. Metoda ataku zależy od następujących czynników: Rodzaj atakującego i cel ataku - określają spodziewaną metodę ataku, Pożądanych efektów ataku - metoda obrana przez atakującego zależy od tego jakie efekty mają być osiągnięte w wyniku przeprowadzenia ataku (przeniknięcie do systemu, doprowadzenie do odmowy usługi), Mechanizmy ataku, Narzędzia realizacji ataku.
, Mechanizmy ataku, Narzędzia realizacji ataku.")
7
Rodzaje ataków (1) Atakujący Cel Atakujący Cel ataku Atakujący
Węzeł pośredniczący Węzeł pośredniczący Cel ataku

8
Rodzaje ataków (2) Atakujący Cel ataku Atakujący Cel ataku Atakujący
 Atakujący Cel ataku Atakujący Cel ataku Atakujący")
9
Rodzaje ataków (3) ATAKUJĄCY Węzeł zarządzający Węzeł docelowy
demona Węzeł zarządzający ATAKUJĄCY Węzeł docelowy (cel ataku)
")
10
Tab.3.4. Prawdopodobieństwo podstawienia adresu IP
Anatomia ataku Czynności przygotowawcze Wykonanie ataku Zwieńczenie 3.1.1 Czynności wstępne Są najważniejszym etapem przeprowadzania ataku. Na etapie tym określony zostaje cel ataku oraz zbierane są informacje o celu dotyczące obsługującego go systemu operacyjnego, konfiguracji i uruchomionych aplikacji, odnalezieniu występujących luk, które wykorzystane zostaną podczas przeprowadzania ataku. W etapie tym atakujący definiuje kanały łączności. Pełna lista kanałów pozwala na wybranie odpowiedniego rodzaju ataku oraz narzędzi umożliwiających jego przeprowadzenie. W oparciu o pozyskane informacje i wynik ich analizy atakujący wybrać może rodzaj ataku, który będzie miał największą szansę powodzenia. Tradycyjne narzędzie zabezpieczające reagują jedynie w etapie drugim, a etapy pierwszy i trzeci są dla nich niewidoczne. Tradycyjne środki bezpieczeństwa nie dają możliwości wykrywania ataków zakończonych w związku z czym są nieprzydatne w procesie przywracania sprawności systemu po ataku. Etap pozyskiwania informacji obejmuje czynności związane z identyfikacją topologii sieci, określeniem rodzajów i wersji systemów operacyjnych kontrolujących poszczególne nazwy, określeniu dostępnych usług. Powyższe czynności realizowane są z użyciem metod: · analiza otoczenia: w ramach tej czynności atakujący próbuje określić adresy systemów zaufanych węzła docelowego, adresy węzłów dysponujących bezpośrednim połączeniem z wybranym wcześniej celem ataku. Ze względu na fakt rozłożenia w czasie analizy oraz inicjowania jej z poza obszaru kontrolowanego przez zabezpieczenia czynność ta jest trudna do wykrycia przez zapory sieciowe i systemy IDS. · określenie topologii sieci : można określić poprzez modulację parametru TTL pakietu i rejestrację trasy pakietu. Pole TTL (czas życia pakietu) nagłówka pakietu IP jest aktualizowane przez routery pośredniczące w transporcie pakietów pomiędzy węzłem źródłowym a docelowym. Do rejestracji trasy wykorzystać można programy umieszczone standardowo w systemach operacyjnych. W przypadku gdy urządzenia sieciowe są źle skonfigurowane pod kątem bezpieczeństwa sieci topologię określić można za pośrednictwem protokołu SNMP. Za pośrednictwem protokołu RIP można uzyskać zawartość tablicy tras obowiązującej w danej sieci. Często metody pozyskiwania topologii sieci przez włamywaczy pokrywają się z metodami analizowania topologii sieci, które wykorzystywane są w celach administracyjnych. · wykrywanie węzłów: realizowane jest poprzez sondowanie sieci programem „Ping”. Program wysyła pod określony adres zapytanie. Jeżeli zwrotnie otrzyma określoną odpowiedź oznacza to, że pod wskazanym adresem rezyduje działający węzeł. Do wykrywania węzłów używa się protokołu ICMP. Istnieje narzędzie pozwalające zautomatyzować proces sondowania dużych sieci składających się z wielu węzłów. W celu wykrycia sondowania należy zastosować zapory sieciowe i systemy wykrywania włamań. Zastosowanie tych zabezpieczeń umożliwia blokowanie pakietów ICMP, lecz jest dla atakującego cennym źródłem informacji wskazującym na obecność w atakowanym systemie urządzeń pierwszej linii obrony (routerów, zapór sieciowych itd.). Istnieją alternatywne metody wykrywania węzłów. Polegają one na identyfikacji węzłów w sieci za pośrednictwem usługi DNS lub trybie pracy interfejsów sieciowych, w którym interfejs odbiera ramki przeznaczone również dla innych węzłów tego samego segmentu sieci. W drugim przypadku atakujący musi posiadać dostęp do segmentu sieci w związku z czym metoda ma zastosowanie głównie do ataków przeprowadzanych w sieci lokalnej. · sondowanie usług: zwane skanowaniem portów. Polega na uzyskaniu listy otwartych portów dla danego węzła. Porty związane są zazwyczaj z usługami bazującymi na protokołach UDP i TCP co umożliwia atakującemu identyfikację usług uruchomionych w sondowanym węźle. · identyfikacja systemu operacyjnego: dokonywana zazwyczaj na podstawie cech szczególnych stosu TCP/IP. Każdy z systemów operacyjnych dysponuje własną implementacją tego stosu. Identyfikacja polega na analizie odpowiedzi wysyłanych przez węzeł będących konsekwencją wcześniejszego wysłania przygotowanych wcześniej pakietów. · określenie roli węzła w sieci: polega na analizie uzyskanych informacji o udostępnionych przez węzeł usługach oraz informacji o topologii sieci. Wykryta nazwa domenowa węzła może nieść informacje o jego charakterze i roli w sieci. · szukanie słabości węzła: polega na przeprowadzeniu analizy zebranych informacji w celu odnalezienia luk w zabezpieczeniach. Atakujący w sposób ręczny lub automatyczny określa podatność badanego węzła na znane typy ataków. 3.1.2 Wykonanie ataku Polega na wykonaniu próby uzyskania dostępu bezpośredniego poprzez penetrację węzła docelowego lub pośredniego polegającego na zablokowaniu węzła. W przypadku dostępu bezpośredniego można wyróżnić dwie fazy ataku: · Penetracja – polega na ominięciu zabezpieczeń w postaci zapór sieciowych. Można to osiągnąć wykorzystując lukę usługi wychodzącej lub infekując węzeł apletem języka Java lub wirusem dołączonym do poczty elektronicznej. Innym podejściem jest próba złamania hasła administratora lub dowolnego innego użytkownika systemu. · Przejęcie kontroli – polega na uzyskaniu pewnego stopnia kontroli nad zaatakowanym węzłem po przeniknięciu do systemu. W celu utrzymania kontroli nad węzłem intruz ingeruje w zawartość plików sterujących rozruchem systemu poprzez umieszczenie procedur rozruchowych instalowanych w węźle koni trojańskich w plikach startowych lub odpowiednich kluczach rejestru systemu. Rozwiązanie takie pozwala utrzymywać kontrolę nad węzłem nawet po ponownym uruchomieniu systemu operacyjnego. Na opanowanym węźle intruz może wykonywać w systemie niemal dowolne czynności. · Cele etapu wykonawczego – celem wykonywania ataku jest uzyskanie nieautoryzowanego dostępu do węzła w celu przechwycenia przechowywanych na nim informacji lub wykorzystaniu węzła do przeprowadzenia ataków na inne węzły. Cel polegający na uzyskaniu dostępu do danych realizowany jest zazwyczaj w drugiej kolejności. W pierwszej kolejności intruz stara się zazwyczaj zapewnić sobie bazę dla przyszłych ataków. Intruz może próbować ukryć rzeczywiste źródła kolejnych ataków lub utrudniać proces wykrycia właściwego źródła. · Metody realizacji ataku – ataki fizyczne są to ataki występujące w momencie posiadania przez intruza fizycznego dostępu do komputera. W tej grupie wyróżniamy ataki polegające na wykorzystaniu specjalnych uprawnień procesu obsługującego terminal lub konsolę oraz fizyczne usunięcie nośników i odczytanie ich zawartości na innym komputerze. Lokalny atak systemowy polega na wykonaniu przez intruza nieautoryzowanych czynności przy założeniu, że posiada on konto w atakowanym systemie. Możliwość taka spowodowana jest występowaniem w systemie luk w zabezpieczeniach umożliwiających intruzowi zwiększenie swoich uprawnień. Atak zdalny polega na próbie spenetrowania systemu docelowego za pośrednictwem sieci komputerowej. W tym przypadku intruz zazwyczaj nie posiada żadnych uprawnień dostępu do atakowanego systemu. Wyróżniamy dwa typy ataków zdalnych: włamanie z sieci lokalnej, włamanie z sieci publicznej. 3.1.3 Zwieńczenie ataku. Celem zwieńczenia ataku jest ukrycie śladów jego przeprowadzenia. Realizowane jest zazwyczaj poprzez usuwanie wybranych wpisów z dziennika systemowego i podjęciu działań mających na celu przywrócenie stanu systemu z przed ataku. Podstawowym zadaniem systemu wykrywania włamań jest identyfikacja włamywacza. Zadanie to może być skomplikowane z powodu używania przez intruzów metod zacierania śladów: · fałszowanie adresów źródła ataku – polega na korzystaniu z serwerów wcześniej zaatakowanych albo serwerów pośredniczących. Stosowanie tej metody utrudnia odnalezienie osoby odpowiedzialnej za atak. Im więcej węzłów pośrednich zaangażowanych w atak tym mniejsza szansa na wykrycie atakującego. Rozpoczęcie blokowania za pomocą zapór sieciowych routerów filtrujących i innych urządzeń sieciowych może doprowadzić do zablokowania adresów uprawnionych użytkowników pod które podszył się atakujący. · tworzenie mylących pakietów – polega na przeprowadzeniu skanowania wabiącego w ramach którego prawdziwy adres źródłowy jest zastępowany adresami fałszywymi. Administrator systemu wykrywania włamań musi wybrać spośród znacznej liczby adresów zarejestrowanych w plikach dziennika właściwy adres IP z którego przeprowadzono atak. Wybór właściwego adresu jest podstawowym problemem. Typ ataku Przykład Prawdopodobieństwo podstawienia adresu IP Pozyskanie informacji traceroute, ping > 1% Skanowanie portów pojedynczy węzeł albo pojedyncza podsieć 5 % Zalewanie wieloma pakietami (odmowa obsługi) Zalewanie pakietami ping, atak Fraggle Prawdopodobieństwo zastosowania pośredniczącego w ataku serwera proxy Atak pojedynczym (serią) pakietem (odmowa obsługi) WinNuke, Ping of Death, zalewanie pakietami SYN 95% Przepełnienie bufora Długie nazwy plików, długie łańcuchy URL 50 % Zdalne wykonanie polecenia Telnet, BackOrifice, Netcat Tab.3.4. Prawdopodobieństwo podstawienia adresu IP · wykorzystywanie cudzego komputera w fazie realizacji ataku – polega na przeprowadzeniu ataku z komputera lub konta, którego atakujący nie jest właścicielem. · fragmentacja ataku – polega na wykorzystaniu mechanizmu dzielenia pakietu IP na szereg pakietów składowych. Sterownik TCP/IP ma możliwość przesyłania pakietów do aplikacji docelowej w postaci zmontowanej (kompletny pakiet) lub fragmentowanej (części pakietów). Współczesne systemy IDS przepuszczają fragmentowane pakiety wysyłając ewentualnie do konsoli sterującej informacje o ich wystąpieniu. Współczesne systemy wykrywania włamań można więc omijać jak również blokować za pomocą narzędzi implementujących fragmentowane ataki. · szyfrowanie ataku – polega na szyfrowaniu dowolną mocną metodą kryptograficzną wszystkich danych związanych z przygotowaniem, przeprowadzeniem i zwieńczeniem ataku. · wykorzystywanie w ataku wartości parametrów różnych od wartości domyślnych. Systemy wyrywania włamań działają w oparciu o założenie, że numer portu jednoznacznie identyfikuje protokół lub usługę. Istnieje możliwość wykorzystania przez włamywacza standardowego protokołu z innym niż przypisany mu domyślnie numerem portu. Większość systemów wykrywania włamań nie będzie w takim przypadku w stanie rozpoznać rodzaju komunikacji. · zmiany standardowych scenariuszy ataków – polegają na zmodyfikowaniu sposobu przeprowadzania ataku np. poprzez zmianę charakterystycznych dla jednego ataku znaków spacji w ciągu poleceń implementujących atak na znaki tabulacji. Większość mechanizmów wykrywania włamań działa na zasadzie porównywania cech obserwowanego ruchu sieciowego z cechami znanych ataków na podstawie określonej bazy danych zawierającej wzorce ataków. · spowolnienie ataku – ze względu na dużą ilość danych rejestrowanych przez system IDS spowolnienie ataku w czasie powoduje spadek jego efektywności. Jeżeli skanowanie portów będzie wykonywane metoda sondowania pojedynczego portu co godzinę, trudno będzie takie skanowanie wykryć. Spowolnienie ataku zmniejsza skuteczność mechanizmów diagnostycznych współczesnych systemów IDS. Nowoczesne skanery portów udostępniają opcje spowalniania sondowania. · czyszczenie dziennika systemu – polega na usunięciu z dzienników wszystkich wpisów dotyczących nieautoryzowanych czynności podejmowanych przez intruza. Jest to jedna z najpopularniejszych metod ukrywania efektów ataku przed administratorem systemu. · ukrywanie plików i danych – polega na usuwaniu atrybutów plików, tak aby system traktował je jako ukryte. Kolejnym podejściem jest wprowadzenie do jądra systemu operacyjnego lub bibliotek systemowych kodu co w efekcie prowadzić będzie do pomijania na listingach katalogów oraz ich zawartości co daje możliwość ukrywania plików. Popularną metodą jest również dołączanie kodu konia trojańskiego do pliku wykonywalnego aplikacji. Koń trojański instaluje się w systemie w sposób automatyczny w momencie uruchomienia aplikacji. · ukrywanie procesów – wymaga ingerencji w kod systemu operacyjnego lub modyfikacji narzędzi odpowiedzialnych za zarządzanie procesami w taki sposób aby proces intruza na wszystkich wywoływanych listach procesów nie był pokazywany. Najprostszą metoda ukrywania procesów jest przypisanie procesowi nazwy upodabniającej go do procesu standardowego.
 nagłówka pakietu IP jest aktualizowane przez routery pośredniczące w transporcie pakietów pomiędzy węzłem źródłowym a docelowym. Do rejestracji trasy wykorzystać można programy umieszczone standardowo w systemach operacyjnych. W przypadku gdy urządzenia sieciowe są źle skonfigurowane pod kątem bezpieczeństwa sieci topologię określić można za pośrednictwem protokołu SNMP. Za pośrednictwem protokołu RIP można uzyskać zawartość tablicy tras obowiązującej w danej sieci. Często metody pozyskiwania topologii sieci przez włamywaczy pokrywają się z metodami analizowania topologii sieci, które wykorzystywane są w celach administracyjnych. · wykrywanie węzłów: realizowane jest poprzez sondowanie sieci programem „Ping . Program wysyła pod określony adres zapytanie. Jeżeli zwrotnie otrzyma określoną odpowiedź oznacza to, że pod wskazanym adresem rezyduje działający węzeł. Do wykrywania węzłów używa się protokołu ICMP. Istnieje narzędzie pozwalające zautomatyzować proces sondowania dużych sieci składających się z wielu węzłów. W celu wykrycia sondowania należy zastosować zapory sieciowe i systemy wykrywania włamań. Zastosowanie tych zabezpieczeń umożliwia blokowanie pakietów ICMP, lecz jest dla atakującego cennym źródłem informacji wskazującym na obecność w atakowanym systemie urządzeń pierwszej linii obrony (routerów, zapór sieciowych itd.). Istnieją alternatywne metody wykrywania węzłów. Polegają one na identyfikacji węzłów w sieci za pośrednictwem usługi DNS lub trybie pracy interfejsów sieciowych, w którym interfejs odbiera ramki przeznaczone również dla innych węzłów tego samego segmentu sieci. W drugim przypadku atakujący musi posiadać dostęp do segmentu sieci w związku z czym metoda ma zastosowanie głównie do ataków przeprowadzanych w sieci lokalnej. · sondowanie usług: zwane skanowaniem portów. Polega na uzyskaniu listy otwartych portów dla danego węzła. Porty związane są zazwyczaj z usługami bazującymi na protokołach UDP i TCP co umożliwia atakującemu identyfikację usług uruchomionych w sondowanym węźle. · identyfikacja systemu operacyjnego: dokonywana zazwyczaj na podstawie cech szczególnych stosu TCP/IP. Każdy z systemów operacyjnych dysponuje własną implementacją tego stosu. Identyfikacja polega na analizie odpowiedzi wysyłanych przez węzeł będących konsekwencją wcześniejszego wysłania przygotowanych wcześniej pakietów. · określenie roli węzła w sieci: polega na analizie uzyskanych informacji o udostępnionych przez węzeł usługach oraz informacji o topologii sieci. Wykryta nazwa domenowa węzła może nieść informacje o jego charakterze i roli w sieci. · szukanie słabości węzła: polega na przeprowadzeniu analizy zebranych informacji w celu odnalezienia luk w zabezpieczeniach. Atakujący w sposób ręczny lub automatyczny określa podatność badanego węzła na znane typy ataków Wykonanie ataku. Polega na wykonaniu próby uzyskania dostępu bezpośredniego poprzez penetrację węzła docelowego lub pośredniego polegającego na zablokowaniu węzła. W przypadku dostępu bezpośredniego można wyróżnić dwie fazy ataku: · Penetracja – polega na ominięciu zabezpieczeń w postaci zapór sieciowych. Można to osiągnąć wykorzystując lukę usługi wychodzącej lub infekując węzeł apletem języka Java lub wirusem dołączonym do poczty elektronicznej. Innym podejściem jest próba złamania hasła administratora lub dowolnego innego użytkownika systemu. · Przejęcie kontroli – polega na uzyskaniu pewnego stopnia kontroli nad zaatakowanym węzłem po przeniknięciu do systemu. W celu utrzymania kontroli nad węzłem intruz ingeruje w zawartość plików sterujących rozruchem systemu poprzez umieszczenie procedur rozruchowych instalowanych w węźle koni trojańskich w plikach startowych lub odpowiednich kluczach rejestru systemu. Rozwiązanie takie pozwala utrzymywać kontrolę nad węzłem nawet po ponownym uruchomieniu systemu operacyjnego. Na opanowanym węźle intruz może wykonywać w systemie niemal dowolne czynności. · Cele etapu wykonawczego – celem wykonywania ataku jest uzyskanie nieautoryzowanego dostępu do węzła w celu przechwycenia przechowywanych na nim informacji lub wykorzystaniu węzła do przeprowadzenia ataków na inne węzły. Cel polegający na uzyskaniu dostępu do danych realizowany jest zazwyczaj w drugiej kolejności. W pierwszej kolejności intruz stara się zazwyczaj zapewnić sobie bazę dla przyszłych ataków. Intruz może próbować ukryć rzeczywiste źródła kolejnych ataków lub utrudniać proces wykrycia właściwego źródła. · Metody realizacji ataku – ataki fizyczne są to ataki występujące w momencie posiadania przez intruza fizycznego dostępu do komputera. W tej grupie wyróżniamy ataki polegające na wykorzystaniu specjalnych uprawnień procesu obsługującego terminal lub konsolę oraz fizyczne usunięcie nośników i odczytanie ich zawartości na innym komputerze. Lokalny atak systemowy polega na wykonaniu przez intruza nieautoryzowanych czynności przy założeniu, że posiada on konto w atakowanym systemie. Możliwość taka spowodowana jest występowaniem w systemie luk w zabezpieczeniach umożliwiających intruzowi zwiększenie swoich uprawnień. Atak zdalny polega na próbie spenetrowania systemu docelowego za pośrednictwem sieci komputerowej. W tym przypadku intruz zazwyczaj nie posiada żadnych uprawnień dostępu do atakowanego systemu. Wyróżniamy dwa typy ataków zdalnych: włamanie z sieci lokalnej, włamanie z sieci publicznej Zwieńczenie ataku. Celem zwieńczenia ataku jest ukrycie śladów jego przeprowadzenia. Realizowane jest zazwyczaj poprzez usuwanie wybranych wpisów z dziennika systemowego i podjęciu działań mających na celu przywrócenie stanu systemu z przed ataku. Podstawowym zadaniem systemu wykrywania włamań jest identyfikacja włamywacza. Zadanie to może być skomplikowane z powodu używania przez intruzów metod zacierania śladów: · fałszowanie adresów źródła ataku – polega na korzystaniu z serwerów wcześniej zaatakowanych albo serwerów pośredniczących. Stosowanie tej metody utrudnia odnalezienie osoby odpowiedzialnej za atak. Im więcej węzłów pośrednich zaangażowanych w atak tym mniejsza szansa na wykrycie atakującego. Rozpoczęcie blokowania za pomocą zapór sieciowych routerów filtrujących i innych urządzeń sieciowych może doprowadzić do zablokowania adresów uprawnionych użytkowników pod które podszył się atakujący. · tworzenie mylących pakietów – polega na przeprowadzeniu skanowania wabiącego w ramach którego prawdziwy adres źródłowy jest zastępowany adresami fałszywymi. Administrator systemu wykrywania włamań musi wybrać spośród znacznej liczby adresów zarejestrowanych w plikach dziennika właściwy adres IP z którego przeprowadzono atak. Wybór właściwego adresu jest podstawowym problemem. Typ ataku. Przykład. Prawdopodobieństwo. podstawienia adresu IP. Pozyskanie informacji. traceroute, ping. > 1% Skanowanie portów. pojedynczy węzeł albo pojedyncza podsieć. 5 % Zalewanie wieloma pakietami (odmowa obsługi) Zalewanie pakietami ping, atak Fraggle. Prawdopodobieństwo zastosowania pośredniczącego w ataku serwera proxy. Atak pojedynczym (serią) pakietem (odmowa obsługi) WinNuke, Ping of Death, zalewanie pakietami SYN. 95% Przepełnienie bufora. Długie nazwy plików, długie łańcuchy URL. 50 % Zdalne wykonanie polecenia. Telnet, BackOrifice, Netcat. Tab.3.4. Prawdopodobieństwo podstawienia adresu IP. · wykorzystywanie cudzego komputera w fazie realizacji ataku – polega na przeprowadzeniu ataku z komputera lub konta, którego atakujący nie jest właścicielem. · fragmentacja ataku – polega na wykorzystaniu mechanizmu dzielenia pakietu IP na szereg pakietów składowych. Sterownik TCP/IP ma możliwość przesyłania pakietów do aplikacji docelowej w postaci zmontowanej (kompletny pakiet) lub fragmentowanej (części pakietów). Współczesne systemy IDS przepuszczają fragmentowane pakiety wysyłając ewentualnie do konsoli sterującej informacje o ich wystąpieniu. Współczesne systemy wykrywania włamań można więc omijać jak również blokować za pomocą narzędzi implementujących fragmentowane ataki. · szyfrowanie ataku – polega na szyfrowaniu dowolną mocną metodą kryptograficzną wszystkich danych związanych z przygotowaniem, przeprowadzeniem i zwieńczeniem ataku. · wykorzystywanie w ataku wartości parametrów różnych od wartości domyślnych. Systemy wyrywania włamań działają w oparciu o założenie, że numer portu jednoznacznie identyfikuje protokół lub usługę. Istnieje możliwość wykorzystania przez włamywacza standardowego protokołu z innym niż przypisany mu domyślnie numerem portu. Większość systemów wykrywania włamań nie będzie w takim przypadku w stanie rozpoznać rodzaju komunikacji. · zmiany standardowych scenariuszy ataków – polegają na zmodyfikowaniu sposobu przeprowadzania ataku np. poprzez zmianę charakterystycznych dla jednego ataku znaków spacji w ciągu poleceń implementujących atak na znaki tabulacji. Większość mechanizmów wykrywania włamań działa na zasadzie porównywania cech obserwowanego ruchu sieciowego z cechami znanych ataków na podstawie określonej bazy danych zawierającej wzorce ataków. · spowolnienie ataku – ze względu na dużą ilość danych rejestrowanych przez system IDS spowolnienie ataku w czasie powoduje spadek jego efektywności. Jeżeli skanowanie portów będzie wykonywane metoda sondowania pojedynczego portu co godzinę, trudno będzie takie skanowanie wykryć. Spowolnienie ataku zmniejsza skuteczność mechanizmów diagnostycznych współczesnych systemów IDS. Nowoczesne skanery portów udostępniają opcje spowalniania sondowania. · czyszczenie dziennika systemu – polega na usunięciu z dzienników wszystkich wpisów dotyczących nieautoryzowanych czynności podejmowanych przez intruza. Jest to jedna z najpopularniejszych metod ukrywania efektów ataku przed administratorem systemu. · ukrywanie plików i danych – polega na usuwaniu atrybutów plików, tak aby system traktował je jako ukryte. Kolejnym podejściem jest wprowadzenie do jądra systemu operacyjnego lub bibliotek systemowych kodu co w efekcie prowadzić będzie do pomijania na listingach katalogów oraz ich zawartości co daje możliwość ukrywania plików. Popularną metodą jest również dołączanie kodu konia trojańskiego do pliku wykonywalnego aplikacji. Koń trojański instaluje się w systemie w sposób automatyczny w momencie uruchomienia aplikacji. · ukrywanie procesów – wymaga ingerencji w kod systemu operacyjnego lub modyfikacji narzędzi odpowiedzialnych za zarządzanie procesami w taki sposób aby proces intruza na wszystkich wywoływanych listach procesów nie był pokazywany. Najprostszą metoda ukrywania procesów jest przypisanie procesowi nazwy upodabniającej go do procesu standardowego.")
11
Podział systemów IDS (1)
Sieciowe (network based) i stanowiskowe (host based) Według faz ataku Network based & host based Podzial wedlug faz ataku Systemy stanowiskowe- są to programy i narzędzia wykrywające luki i ataki na pojedynczy węzeł sieci. Systemy sieciowe- są to systemy projektowane w celu ochrony całej sieci lub jej segmentów. Stanowiskowe systemy wykrywania włamań można podzielić na następujące podgrupy: a) systemy wykrywania włamań działające na poziomie aplikacji użytkowych. Zadaniem tych systemów jest wykrywanie ataków na konkretne aplikacje i ich dane. b) systemy wykrywania włamań funkcjonujące na poziomie systemu operacyjnego. Zadaniem tych systemów jest ochrona przed atakami na system operacyjny i jego narzędzia. c) systemy wykrywania włamań na poziomie baz danych. Ze względu na bardzo dużą d) złożoność systemów zarządzania bazami danych porównywalną do złożoności systemów operacyjnych zaistniała konieczność wydzielenia systemów, których celem jest wykrywanie włamań w otoczeniu baz danych. Systemy te mogą operować lokalnie lub w segmencie sieci. Oddzielną klasą systemów są systemy hybrydowe wielowarstwowe lub z pamięcią stanów, które często łączą w sobie cechy charakteryzujące systemy według przedstawionych powyżej podziałów.
 i stanowiskowe (host based) Według faz ataku. Network based & host based. Podzial wedlug faz ataku. Systemy stanowiskowe- są to programy i narzędzia wykrywające luki i ataki na pojedynczy węzeł sieci. Systemy sieciowe- są to systemy projektowane w celu ochrony całej sieci lub jej segmentów. Stanowiskowe systemy wykrywania włamań można podzielić na następujące podgrupy: a) systemy wykrywania włamań działające na poziomie aplikacji użytkowych. Zadaniem tych systemów jest wykrywanie ataków na konkretne aplikacje i ich dane. b) systemy wykrywania włamań funkcjonujące na poziomie systemu operacyjnego. Zadaniem tych systemów jest ochrona przed atakami na system operacyjny i jego narzędzia. c) systemy wykrywania włamań na poziomie baz danych. Ze względu na bardzo dużą. d) złożoność systemów zarządzania bazami danych porównywalną do złożoności systemów operacyjnych zaistniała konieczność wydzielenia systemów, których celem jest wykrywanie włamań w otoczeniu baz danych. Systemy te mogą operować lokalnie lub w segmencie sieci. Oddzielną klasą systemów są systemy hybrydowe wielowarstwowe lub z pamięcią stanów, które często łączą w sobie cechy charakteryzujące systemy według przedstawionych powyżej podziałów.")
12
Podział systemów IDS (2)
Systemy wykrywające naruszenie reguł bezpieczeństwa Sieciowe skanery bezpieczeństwa Klasyczne systemy wykrywania włamań Systemy wykrywające ślady przeprowadzonych ataków Systemy kontroli spójności Analizatory plików dzienników „Wabiki”, „pułapki internetowe (honey pots) Systemy działające w pierwszej fazie ataku- są to systemy wykrywające ataki potencjalne (luki w zabezpieczeniach). Do tej grupy należą narzędzia zwane skanerami bezpieczeństwa. Systemy działające w drugiej fazie ataku. Zadaniem tych systemów jest wykrywanie ataków w czasie ich trwania. Systemy te działają w czasie rzeczywistym albo w czasie zbliżonym do rzeczywistego. Do tej grupy systemów należą systemy działające jako przynęty. Systemy działające w trzecim etapie ataku. Są to systemy wykrywające ataki już przeprowadzone i zakończone. Do tej grupy systemów należą programy kontrolujące spójność systemu oraz analizujące informacje umieszczone w plikach dzienników. Systemy detekcji intruzów sklasyfikować można również biorąc pod uwagę ich obszar i zasięg działania.
 Systemy działające w pierwszej fazie ataku- są to systemy wykrywające ataki potencjalne (luki w zabezpieczeniach). Do tej grupy należą narzędzia zwane skanerami bezpieczeństwa. Systemy działające w drugiej fazie ataku. Zadaniem tych systemów jest wykrywanie ataków w czasie ich trwania. Systemy te działają w czasie rzeczywistym albo w czasie zbliżonym do rzeczywistego. Do tej grupy systemów należą systemy działające jako przynęty. Systemy działające w trzecim etapie ataku. Są to systemy wykrywające ataki już przeprowadzone i zakończone. Do tej grupy systemów należą programy kontrolujące spójność systemu oraz analizujące informacje umieszczone w plikach dzienników. Systemy detekcji intruzów sklasyfikować można również biorąc pod uwagę ich obszar i zasięg działania.")
13
O X się próbuje włamać... Drop all src= X
Systemy IDS a IPS O X się próbuje włamać... Drop all src= X O, X się włamał... Intrusion detection systems via intrusion prevention systems IDS IPS

14
Lokalizacja systemu IDS
Switch Router SPAN (switch port analyzer) HUB Taps&TopLayer switches Router Gdzie i jak umieścić system IDS. środowisko przęłączane=problem Środowisko o port monitora network tap. Hub IDS Switch
 HUB. Taps&TopLayer switches. Router. Gdzie i jak umieścić system IDS. środowisko przęłączane=problem. Środowisko o. port monitora. network tap. Hub. IDS. Switch.")
15
Taps

16
Wydajne architektury IDS
„Stateful Intrusion Detection for HighSpeed Networks”, Kruegel Ch., Valeur F., Vigna G. Kemmerer R., 2002

17
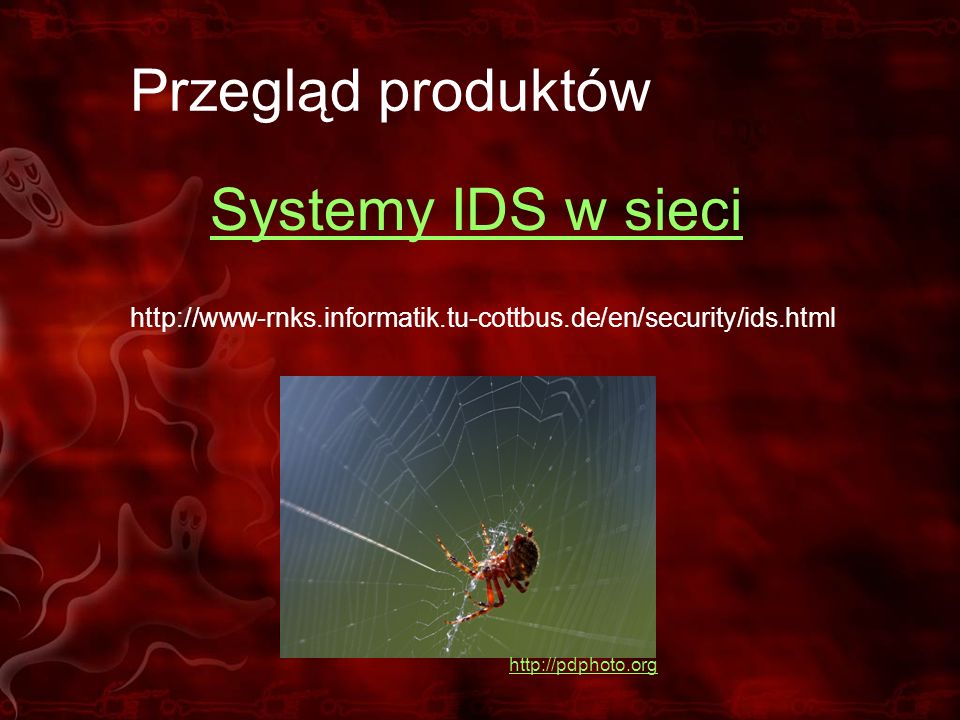
Przegląd produktów Systemy IDS w sieci
18
Common Intrusion Detection Framework
GIDOs Event(E-)Box Sensor, Passive Protocol Analyzer ETHERNET Storage, Data (D-)box Analysis(A-)Box Pattern matching, Signature analysis The Common Intrusion Detection Framework (CIDF) Stuart Staniford-Chen*, Department of Computer Science, University of California at Davis. Brian Tung, Information Sciences Institute, University of Southern California. Dan Schnackenberg, The Boeing Company. * Presenting 1. Introduction This position paper is intended to provide a quick overview of the objectives and approach taken by the Common Intrusion Detection Framework (CIDF) working group. This working group was formed as a collaboration between DARPA (Defense Advanced Research Projects Agency) funded intrusion detection and response (IDR) projects, although the effort is now open to anyone who wishes to participate. The goal of the CIDF working group is to develop a set of specifications enabling- - Different IDR components to interoperate and share information as richly as possible. These components include sensors that generate intrusion-related information; analysis engines that determine whether some anomaly/intrusion has occured warranting response; and response components, including network management, firewalls, filtering routers, and hosts. - IDR subsystems to be easily re-used in contexts different from those they were designed for. This document first provides some background explaining the need for standardization. This is followed by the objectives and requirements for interoperable IDR components that were developed by the CIDF working group, and then the approach taken by the CIDF working group. 2. Background Attacks against computer networks and systems are growing ever more sophisticated. It is no longer expected or possible for a single ID system to deal with every plausible form of attack. At the same time, those attacks are taking place on a grander scale. They can be orchestrated across a wide-area network, and over a long period of time. The need to deploy a *distributed* ID system is becoming increasingly urgent. In such an environment, the ability of intrusion detection systems and their components to share *advanced* information about these attacks is especially important. Such sharing would allow systems to combine attack indicators to more accurately identify and pinpoint attacks. Integration with response components and network management systems would also allow administrators to automatically deploy sophisticated response and recovery tactics. In order to share that information, however, the various systems must agree on how to express it. Furthermore, since these ID systems may be deployed in widely varying environments, they must also agree on how to locate and communicate with one another. 3. Objectives and Requirements The overall objective is to enable software reuse and interoperability for IDR components. The infrastructure on which the IDR components rely for interoperability must be secure, robust, and scalable. The focus of the CIDF working group's efforts has been to define an application-layer "language" for describing information of interest to IRD components, and a protocol for encoding that information for sharing between components. First, the *language* used to express information about intrusions and related matters must describe objects that are almost arbitrary, so that the format of expressions should not be a fixed format. Instead, the language must be flexible enough to allow a component to express whatever relevant information it has available. At the same time, the language must not be so free-form that the receiving component cannot interpret it. This language should have a wide enough vocabulary and sophisticated enough syntax to cover a broad range of expressions. This language must be expressive enough to express- - raw event information (e.g., audit trail records and network traffic) - analysis results (e.g., descriptions of system anomalies and detected attacks) - response prescriptions (e.g., halt particular activities or modify component security parameters) This language must also allow one to express relationships between events, to justify analysis results, and to explain complex responses (e.g., if this happens, then do that, else do the other thing). In short, one must be able to write "sentences" that are about other sentences. To be more specific, this language should be able to express at least the following: - relationships among events (e.g., causal or order) - the roles of objects in events, such as initiator - properties of objects, such as name - relationships of objects to other objects, such as owner Beyond expressiveness, the language must also have the following attributes. 1. Unique in expression. It is probably not possible to have an expressive language that literally admits of exactly one formulation for each sentiment. Our requirement, therefore, is as follows: If a sender and a receiver can agree on the *objects* of interest, but not on the *way* they will express information about those objects, then they should still be able to understand each other. If they cannot, then the language is too arbitrary. 2. Precise. Two receivers reading the same message must not draw mutually contradictory conclusions from it. 3. Layered. There should be a mechanism in the language by which specific concepts are defined in terms of more general ones. 4. Self-defining. It should be self-evident from a message how each datum within it should be interpreted. For example, a sequence of four octets (i.e., bytes) is not merely four octets, but an IPv4 address; and not merely an IPv4 address, but the address of a host; and not merely the address of a host, but the address of a host from which an FTP command was issued; and so forth. 5. Extensible. There should be a mechanism by which a sender can use its own vocabulary, and indicate that fact to receivers, in such a way that receivers can either recover the meaning of the new vocabulary, or decide whether and how to interpret the rest of a message in which it occurs. The method of encoding this information must also have the following attributes- 1. Efficient. In comparison with a hard-wired format, a format that can be understood by any compliant receiver should be no more than twice as long over the long run. (In other words, the marginal cost of using this language should be no more than a factor of two.) 2. Simple. Components that do not need to understand the semantics of the full language to fulfil their role in the system (e.g., sensors) should not be required to understand the full language to send and receive simple messages. 3. Portable. The encoding for the language should not depend on the endian-ness of the host on which a message is encoded, or on the details of its networking. 4. Minimal Complexity. Providing a language that meets the above objectives will be necessarily complex, however, the language and encoding complexity should be minimized to the extent feasible. Countermeasures(C-)Box (ie. close connection)
Box. Sensor, Passive Protocol Analyzer. ETHERNET. Storage, Data (D-)box. Analysis(A-)Box. Pattern matching, Signature analysis. The Common Intrusion Detection Framework (CIDF) Stuart Staniford-Chen*, Department of Computer Science, University of. California at Davis. Brian Tung, Information Sciences Institute, University of Southern California. Dan Schnackenberg, The Boeing Company. * Presenting. 1. Introduction. This position paper is intended to provide a quick overview of the. objectives and approach taken by the Common Intrusion Detection. Framework (CIDF) working group. This working group was formed as a. collaboration between DARPA (Defense Advanced Research Projects. Agency) funded intrusion detection and response (IDR) projects, although the effort is now open to anyone who wishes to participate. The goal of the CIDF working group is to develop a set of. specifications enabling- - Different IDR components to interoperate and share information. as richly as possible. These components include sensors that. generate intrusion-related information; analysis engines that. determine whether some anomaly/intrusion has occured warranting. response; and response components, including network management, firewalls, filtering routers, and hosts. - IDR subsystems to be easily re-used in contexts different from. those they were designed for. This document first provides some background explaining the need for. standardization. This is followed by the objectives and requirements. for interoperable IDR components that were developed by the CIDF. working group, and then the approach taken by the CIDF working group. 2. Background. Attacks against computer networks and systems are growing ever more. sophisticated. It is no longer expected or possible for a single. ID system to deal with every plausible form of attack. At the same time, those attacks are taking place on a grander scale. They can be orchestrated across a wide-area network, and over a long. period of time. The need to deploy a *distributed* ID system is. becoming increasingly urgent. In such an environment, the ability of intrusion detection systems. and their components to share *advanced* information about these. attacks is especially important. Such sharing would allow systems to. combine attack indicators to more accurately identify and pinpoint. attacks. Integration with response components and network management. systems would also allow administrators to automatically deploy. sophisticated response and recovery tactics. In order to share that information, however, the various systems must. agree on how to express it. Furthermore, since these ID systems may. be deployed in widely varying environments, they must also agree on how. to locate and communicate with one another. 3. Objectives and Requirements. The overall objective is to enable software reuse and interoperability. for IDR components. The infrastructure on which the IDR components. rely for interoperability must be secure, robust, and scalable. The. focus of the CIDF working group s efforts has been to define an. application-layer language for describing information of interest to. IRD components, and a protocol for encoding that information for. sharing between components. First, the *language* used to express information about intrusions and. related matters must describe objects that are almost arbitrary, so. that the format of expressions should not be a fixed format. Instead, the language must be flexible enough to allow a component to express. whatever relevant information it has available. At the same time, the. language must not be so free-form that the receiving component cannot. interpret it. This language should have a wide enough vocabulary and sophisticated. enough syntax to cover a broad range of expressions. This language. must be expressive enough to express- - raw event information (e.g., audit trail records and network. traffic) - analysis results (e.g., descriptions of system anomalies and. detected attacks) - response prescriptions (e.g., halt particular activities or. modify component security parameters) This language must also allow one to express relationships between. events, to justify analysis results, and to explain complex responses. (e.g., if this happens, then do that, else do the other thing). In. short, one must be able to write sentences that are about other. sentences. To be more specific, this language should be able to. express at least the following: - relationships among events (e.g., causal or order) - the roles of objects in events, such as initiator. - properties of objects, such as name. - relationships of objects to other objects, such as owner. Beyond expressiveness, the language must also have the following. attributes. 1. Unique in expression. It is probably not possible to have an. expressive language that literally admits of exactly one. formulation for each sentiment. Our requirement, therefore, is as follows: If a sender and a receiver can agree on the. *objects* of interest, but not on the *way* they will express. information about those objects, then they should still be. able to understand each other. If they cannot, then the. language is too arbitrary. 2. Precise. Two receivers reading the same message must not. draw mutually contradictory conclusions from it. 3. Layered. There should be a mechanism in the language by which. specific concepts are defined in terms of more general ones. 4. Self-defining. It should be self-evident from a message how. each datum within it should be interpreted. For example, a. sequence of four octets (i.e., bytes) is not merely four octets, but an IPv4 address; and not merely an IPv4 address, but the. address of a host; and not merely the address of a host, but. the address of a host from which an FTP command was issued; and. so forth. 5. Extensible. There should be a mechanism by which a sender. can use its own vocabulary, and indicate that fact to. receivers, in such a way that receivers can either recover. the meaning of the new vocabulary, or decide whether and how. to interpret the rest of a message in which it occurs. The method of encoding this information must also have the following. attributes- 1. Efficient. In comparison with a hard-wired format, a format. that can be understood by any compliant receiver should be. no more than twice as long over the long run. (In other. words, the marginal cost of using this language should be. no more than a factor of two.) 2. Simple. Components that do not need to understand the. semantics of the full language to fulfil their role in the. system (e.g., sensors) should not be required to understand. the full language to send and receive simple messages. 3. Portable. The encoding for the language should not depend on. the endian-ness of the host on which a message is encoded, or. on the details of its networking. 4. Minimal Complexity. Providing a language that meets the above. objectives will be necessarily complex, however, the language. and encoding complexity should be minimized to the extent. feasible. Countermeasures(C-)Box. (ie. close connection)")
19
Przykład S-wyrażeń i GIDO
(Delete (Context (HostName 'first.example.com') (Time '16:40:32 Jun ') ) (Initiator (UserName 'joe') (Source (FileName '/etc/passwd') 4. Current CIDF Language and Encoding In this section, we will describe the approach that the CIDF group has taken toward achieving these objectives. We do not claim that it is the only possible approach, but it is the one that the current CIDF group has agreed upon. The CIDF group decided on a format called S-expressions, which like Lisp expressions are lists grouped within parentheses. These S-expressions are headed by semantic identifiers, or SIDs for short, which indicate some semantics for the grouped list. For example, the S-expression (HostName 'first.example.com') is headed by the SID HostName, which indicates that the following string, 'first.example.com', is to be interpreted as the name of a host. Larger S-expressions may indicate the role of that host within an event, say. For instance, the following S-expression (Delete (Context (Time '16:40:32 Jun ') ) (Initiator (UserName 'joe') (Source (FileName '/etc/passwd') is a complete sentence asserting that the user with username 'joe' deleted the file '/etc/passwd' from the host 'first.example.com' at 16:40:32 on Jun This example highlights special kinds of SIDs, such as verb SIDs (e.g., Delete) that show what happened, and role SIDs (e.g., Context, Initiator, and Source) that show "whodunit", and what it was done to, where it was done, and so forth. Other SIDs give details (such as the time) about these various components of the event. These "sentences" in ASCII form are inefficient, so to save space, we have developed an encoding format that reduces the size of the messages. When properly encapsulated, these encoded sentences form Generalized Intrusion Detection Objects, or GIDOs for short (CIDF is certainly not short on acronyms, as you can see!). In fact, the terms "sentence" and GIDO are often used interchangeably. 5. Infrastructure Before ID components can even speak to each other, they must locate other components who have some reason to talk to them. A common language is no use if there is no common sphere of interest. Therefore, CIDF is also developing a "matchmaking" service which connects components that produce certain kinds of GIDOs with those that consume them. The basic approach is to use a large scale directory service, LDAP (Lightweight Directory Access Protocol). Each components registers with the directory service and advertises the kinds of GIDOs it consumes and/or produces. On this basis the components are placed into *categories*, which allow other components to easily find those they wish to talk to. The directory may also contain public key certificates, which allow components to authenticate each other and to verify each other's authorization information before sending GIDOs back and forth. The additional infrastructure requirements is for a message layer that provide secure (privacy, authenticity, and integrity mechanisms), reliable, messaging in environements subject to attack. 6. Status (July 1998) The CIDF language, APIs, and infrastructure are far from complete. The language needs to be constrained further to eliminate confusing ambiguities, there is still much of the directory service that needs to be ironed out, and there is a need for common APIs to meet this intial objective of reusable components. Nevertheless, the CIDF working group is making progress. We recently conducted an interoperability test, involving independently developed programs using the CIDF specification. Many of the programs achieved full interoperability (within the limited scope of their tests), and two other programs attempting to do real (albeit simple) intrusion detection came within a hair's breadth of interoperating on the very first try. We are presently planning a more complete test of CIDF in which several IDS systems will interoperate - this is slated for March '99.
 (Time 16:40:32 Jun ) ) (Initiator. (UserName joe ) (Source. (FileName /etc/passwd ) 4. Current CIDF Language and Encoding. In this section, we will describe the approach that the CIDF group has. taken toward achieving these objectives. We do not claim that it is. the only possible approach, but it is the one that the current CIDF. group has agreed upon. The CIDF group decided on a format called S-expressions, which like. Lisp expressions are lists grouped within parentheses. These. S-expressions are headed by semantic identifiers, or SIDs for short, which indicate some semantics for the grouped list. For example, the. S-expression. (HostName first.example.com ) is headed by the SID HostName, which indicates that the following. string, first.example.com , is to be interpreted as the name of a. host. Larger S-expressions may indicate the role of that host within. an event, say. For instance, the following S-expression. (Delete. (Context. (Time 16:40:32 Jun ) ) (Initiator. (UserName joe ) (Source. (FileName /etc/passwd ) is a complete sentence asserting that the user with username joe deleted the file /etc/passwd from the host first.example.com at. 16:40:32 on Jun This example highlights special kinds of. SIDs, such as verb SIDs (e.g., Delete) that show what happened, and. role SIDs (e.g., Context, Initiator, and Source) that show whodunit , and what it was done to, where it was done, and so forth. Other SIDs. give details (such as the time) about these various components of the. event. These sentences in ASCII form are inefficient, so to save space, we. have developed an encoding format that reduces the size of the messages. When properly encapsulated, these encoded sentences form Generalized. Intrusion Detection Objects, or GIDOs for short (CIDF is certainly not. short on acronyms, as you can see!). In fact, the terms sentence and. GIDO are often used interchangeably. 5. Infrastructure. Before ID components can even speak to each other, they must locate. other components who have some reason to talk to them. A common. language is no use if there is no common sphere of interest. Therefore, CIDF is also developing a matchmaking service which. connects components that produce certain kinds of GIDOs with those. that consume them. The basic approach is to use a large scale directory service, LDAP. (Lightweight Directory Access Protocol). Each components registers. with the directory service and advertises the kinds of GIDOs it. consumes and/or produces. On this basis the components are placed. into *categories*, which allow other components to easily find those. they wish to talk to. The directory may also contain public key certificates, which allow. components to authenticate each other and to verify each other s. authorization information before sending GIDOs back and forth. The additional infrastructure requirements is for a message layer that. provide secure (privacy, authenticity, and integrity mechanisms), reliable, messaging in environements subject to attack. 6. Status (July 1998) The CIDF language, APIs, and infrastructure are far from complete. The language needs to be constrained further to eliminate confusing. ambiguities, there is still much of the directory service that needs. to be ironed out, and there is a need for common APIs to meet this. intial objective of reusable components. Nevertheless, the CIDF working group is making progress. We recently. conducted an interoperability test, involving independently developed. programs using the CIDF specification. Many of the programs achieved. full interoperability (within the limited scope of their tests), and. two other programs attempting to do real (albeit simple) intrusion. detection came within a hair s breadth of interoperating on the very. first try. We are presently planning a more complete test of CIDF in which several. IDS systems will interoperate - this is slated for March 99.")
20
Agenda Analiza i korelacja danych Trochę teorii
Snort – de facto standard Wizualizacje i raporty Aplikacje zarządzające Podsumowanie Ogólny outline prezentacji. Co zostanie zasygnalizowane w prezentacji

21
Analiza danych = problemy
Jak korelować informacje? Jakich metod można użyć? Jak powiązać połączenia inicjowane w wielu sesjach, z różnych adresów, źródłowych na rozmaite adresy docelowe? Jak zidentyfikować intruza? Problemy w IDS Problem 1.: Jakie metody można użyć? Problem 2.: Jaka powinna być struktura systemów wykrywania włamań? Problem 3.: Co to jest włamanie? Problem 4.: Jak zidentyfikować tożsamość intruza? Problem 5.: Jak korelować informacje? Problem 6.: Jak złapać intruza w pułapkę? Problem 7.: Jak reagować na incydenty? Metody Przetwarzanie raportu audytu Przetwarzanie na bieżąco Profile normalnego zachowania Sygnatury nienormalnego zachowania Zgodność przetwarzania ze wzorcem

22
Eksploracja danych MINDS (Minesota) PROJECT IDS (Columbia): SilkRoad inc. MINDS: The overall objective of this research is to develop high performance data mining algorithms and tools that will provide support required to analyze the massive data sets generated by various processes that monitor computing and information systems. This research is being conducted as a part of MINDS (Minnesota Intrusion Detection System) project that is developing a suite of data mining techniques to automatically detect attacks against computer networks and systems. Figure 1 illustrates the MINDS system applied to real network traffic data. There are several integral parts of the research within this project: Filtering / Preprocessing / Known attack detection module Scan detector Anomaly detection algorithms Summarization of attacks using association pattern analysis PROJECT IDS: This project is a data-mining based approach to detecting intruders in computer systems. The project approaches the intrusion detection problem from a data-mining perspective. Large quantities of data are collected from the system and analyzed to build models of normal behavior and intrusion behavior. These models are evaluated on data collected in real time to detect intruders. SilkRoad (fragment przykładowego artykułu): Next generation cyberspace intrusion detection (ID) systems will require the fusion of data from myriad heterogeneous distributed network sensors to effectively create cyberspace situational awareness. This article provides a functional overview of how the art and science of multisensor data fusion can enhance the performance and reliability of ID systems. The article also discusses the data fusion inference process and data mining operations, outlines design challenges, and suggests areas for further research and development.
 project that is developing a suite of data mining techniques to automatically detect attacks against computer networks and systems. Figure 1 illustrates the MINDS system applied to real network traffic data. There are several integral parts of the research within this project: Filtering / Preprocessing / Known attack detection module. Scan detector. Anomaly detection algorithms Summarization of attacks using association pattern analysis. PROJECT IDS: This project is a data-mining based approach to detecting intruders in computer systems. The project approaches the intrusion detection problem from a data-mining perspective. Large quantities of data are collected from the system and analyzed to build models of normal behavior and intrusion behavior. These models are evaluated on data collected in real time to detect intruders. SilkRoad (fragment przykładowego artykułu): Next generation cyberspace intrusion detection (ID) systems will require the fusion of data from myriad heterogeneous distributed network sensors to effectively create cyberspace situational awareness. This article provides a functional overview of how the art and science of multisensor data fusion can enhance the performance and reliability of ID systems. The article also discusses the data fusion inference process and data mining operations, outlines design challenges, and suggests areas for further research and development.")
23
Metody (1) Grupowanie (Clustering) Odkrywanie Asocjacji (Association)
Analiza statystyczna (Statistical Analysis) Generacja reguł (Rule Abduction) Odkrywanie powiązań lub generacja drzew decyzyjnych (Link or Tree Abduction) Analiza odchyleń statystycznych (Deviation Analysis) Uczenie sieci neuronowych (Neural Abduction) Clustering is when data is segmented into subsets that share common properties. Association is the analysis of both the cause-and-effect and the structure of relationships between data sets. Statistical Analysis is performed to determine the likelihood of characteristics and associations in selected data sets. Rule Abduction is the development of IF-THEN-ELSE rules that describe associations, structures and the test rules. Link or Tree Abduction is performed to discover relationships between data sets and interesting connecting pattern properties. Deviation Analysis locates and analyzes deviations from normal statistical behavior. Neural Abduction is the process of training artificial neural networks to match data, extract node weights and structure (similar to abducted rule sets).
 Generacja reguł (Rule Abduction) Odkrywanie powiązań lub generacja drzew decyzyjnych (Link or Tree Abduction) Analiza odchyleń statystycznych (Deviation Analysis) Uczenie sieci neuronowych (Neural Abduction) Clustering. is when data is segmented into subsets that share common properties. Association. is the analysis of both the cause-and-effect and the structure of relationships between data sets. Statistical Analysis. is performed to determine the likelihood of characteristics and associations in selected data sets. Rule Abduction. is the development of IF-THEN-ELSE rules that describe associations, structures and the test rules. Link or Tree Abduction. is performed to discover relationships between data sets and interesting connecting pattern properties. Deviation Analysis. locates and analyzes deviations from normal statistical behavior. Neural Abduction. is the process of training artificial neural networks to match data, extract node weights and structure (similar to abducted rule sets).")
24
Metody (2) Anomaly detection algorithms (np. MINDS)
Models of normal behavior and intrusion behavior (np. PROJECT IDS) Myriad heterogeneous distributed network sensors „ cyberspace situational awareness” (patrz artykuł na stronach SilkRoad Inc.)
 Myriad heterogeneous distributed network sensors „ cyberspace situational awareness (patrz artykuł na stronach SilkRoad Inc.)")
25
Agenda Analiza i korelacja danych Trochę teorii
Snort – standard de facto Wizualizacje i raporty Aplikacje zarządzające Podsumowanie Ogólny outline prezentacji. Co zostanie zasygnalizowane w prezentacji

26
Snort – de facto standard...
Martin Roesch Rok 1998 „Lightweight” intrusion detection system Najczęściej stosowany system detekcji intruzów na świecie „Heavyweight” champion In 1998, Martin Roesch wrote an open source technology called Snort, which he termed a "lightweight" intrusion detection technology in comparison to commercially available systems. Today that moniker doesn't even begin to describe the capabilities that Snort brings to the table as the most widely deployed intrusion prevention technology worldwide. Over the years Snort has evolved into a mature, feature rich technology that has become the de facto standard in intrusion detection and prevention. Recent advances in both the rules language and detection capabilities offer the most flexible and accurate threat detection available, making Snort the "heavyweight" champion of intrusion prevention.

27
Świat Snort-a

28
Sourcefire Firma komercyjna utworzona przez Martin Roesch-a w 2001 roku Oferuje produkty komercyjne oparte o Snort-a i pochodne Rozwiązania dla sieci Gbit-owych. Przejęta przez CheckPoint-a

29
Snort – wymagania i instalacja
Pentium, 64MB RAM, 1GB HDD, 10Mbps Ethernet NIC „That's about the bare minimum..” M. Roesch-czerwiec ’05 Libpcap, tcpdump, iptables (Snort inline), libnet GD, Perl, Adodb, MySQL, PHP
, libnet. GD, Perl, Adodb, MySQL, PHP.")
30
Snort – instalacja Podstawowa:
Pobieramy źródła: wget linux# tar –zxvf snort tar.gz cd snort-2.4.3 ./configure make make install Pobieramy reguły (lub piszemy własne ) : Bardziej złożone instalacje: The "generic" notes for putting this thing together are below. Here's the short version. 1.) *** Make sure you have libpcap installed!!! *** 2.) ./configure 3.) make 4.) make install 5.) Create a sample rules file (if you want to use rules, check out the included snort.conf file) 6.) snort -? 7.) If you've used previous versions of Snort, you may need to rewrite your rules to make them compliant to the rules format. See snort_manual.pdf or for more information. 8.) Have fun! Any questions? Sign up to the snort-users mailing list at Snort Configure-time switches ============================= `--enable-debug' Enable debugging options (bugreports and developers only). `--with-snmp' Enable SNMP alerting code. `--enable-flexresp' Enable the 'Flexible Response' code, that allows you to cancel hostile connections on IP-level when a rule matches. When you enable this feature, you also need the 'libnet'-library that can be found at See README.FLEXRESP for details. This function is still ALPHA, so use with caution. `--with-mysql=DIR' Support for mysql, turn this on if you want to use ACID with MySQL. `--with-odbc=DIR' Support for ODBC databases, turn this on if you want to use ACID with a non-listed DB. `--with-postgresql=DIR' Support for Postgresql databases, turn this on if you want to use ACID with PostgreSQL. `--with-oracle=DIR' Support for Oracle databases, turn this on if you want to use ACID with Oracle. `--with-openssl=DIR' Support for openssl (used by the XML output plugin). `--with-libpq-includes=DIR' Set the include directories for Postgres SQL database support to DIR. `--with-libpq-libraries=DIR' Set the library directories for Postgres SQL database support to DIR. Setting both of these values enables the Postgres output plugin module. `--with-libpcap-includes=DIR' If the configuration script can't find the libpcap include files on its own, the path can be set manually with this switch. `--with-libpcap-libraries=DIR' If the configuration script can't find the libpcap library files on its `--with-libxml2-includes=DIR' Libxml2 include directory. `--with-libxml2-libraries=DIR' Libxml2 library directory. `--with-libntp-libraries=DIR' Libntp library directory. `--with-libidmef-includes=DIR' Libidmef include directory. `--with-libidmef-libraries=DIR' Libidmef library directory. Basic Installation ================== These are generic installation instructions. The `configure' shell script attempts to guess correct values for various system-dependent variables used during compilation. It uses those values to create a `Makefile' in each directory of the package. It may also create one or more `.h' files containing system-dependent definitions. Finally, it creates a shell script `config.status' that you can run in the future to recreate the current configuration, a file `config.cache' that saves the results of its tests to speed up reconfiguring, and a file `config.log' containing compiler output (useful mainly for debugging `configure'). If you need to do unusual things to compile the package, please try to figure out how `configure' could check whether to do them, and mail diffs or instructions to the address given in the `README' so they can be considered for the next release. If at some point `config.cache' contains results you don't want to keep, you may remove or edit it. The file `configure.in' is used to create `configure' by a program called `autoconf'. You only need `configure.in' if you want to change it or regenerate `configure' using a newer version of `autoconf'. The simplest way to compile this package is: 1. `cd' to the directory containing the package's source code and type `./configure' to configure the package for your system. If you're using `csh' on an old version of System V, you might need to type `sh ./configure' instead to prevent `csh' from trying to execute `configure' itself. Running `configure' takes awhile. While running, it prints some messages telling which features it is checking for. 2. Type `make' to compile the package. 3. Optionally, type `make check' to run any self-tests that come with the package. 4. Type `make install' to install the programs and any data files and documentation. 5. You can remove the program binaries and object files from the source code directory by typing `make clean'. To also remove the files that `configure' created (so you can compile the package for a different kind of computer), type `make distclean'. There is also a `make maintainer-clean' target, but that is intended mainly for the package's developers. If you use it, you may have to get all sorts of other programs in order to regenerate files that came with the distribution. Compilers and Options ===================== Some systems require unusual options for compilation or linking that the `configure' script does not know about. You can give `configure' initial values for variables by setting them in the environment. Using a Bourne-compatible shell, you can do that on the command line like this: CC=c89 CFLAGS=-O2 LIBS=-lposix ./configure Or on systems that have the `env' program, you can do it like this: env CPPFLAGS=-I/usr/local/include LDFLAGS=-s ./configure Compiling For Multiple Architectures ==================================== You can compile the package for more than one kind of computer at the same time, by placing the object files for each architecture in their own directory. To do this, you must use a version of `make' that supports the `VPATH' variable, such as GNU `make'. `cd' to the directory where you want the object files and executables to go and run the `configure' script. `configure' automatically checks for the source code in the directory that `configure' is in and in `..'. If you have to use a `make' that does not supports the `VPATH' variable, you have to compile the package for one architecture at a time in the source code directory. After you have installed the package for one architecture, use `make distclean' before reconfiguring for another architecture. Installation Names By default, `make install' will install the package's files in `/usr/local/bin', `/usr/local/man', etc. You can specify an installation prefix other than `/usr/local' by giving `configure' the option `--prefix=PATH'. You can specify separate installation prefixes for architecture-specific files and architecture-independent files. If you give `configure' the option `--exec-prefix=PATH', the package will use PATH as the prefix for installing programs and libraries. Documentation and other data files will still use the regular prefix. In addition, if you use an unusual directory layout you can give options like `--bindir=PATH' to specify different values for particular kinds of files. Run `configure --help' for a list of the directories you can set and what kinds of files go in them. If the package supports it, you can cause programs to be installed with an extra prefix or suffix on their names by giving `configure' the option `--program-prefix=PREFIX' or `--program-suffix=SUFFIX'. Optional Features ================= Some packages pay attention to `--enable-FEATURE' options to `configure', where FEATURE indicates an optional part of the package. They may also pay attention to `--with-PACKAGE' options, where PACKAGE is something like `gnu-as' or `x' (for the X Window System). The `README' should mention any `--enable-' and `--with-' options that the package recognizes. For packages that use the X Window System, `configure' can usually find the X include and library files automatically, but if it doesn't, you can use the `configure' options `--x-includes=DIR' and `--x-libraries=DIR' to specify their locations. The following configuration switches are available for Snort: Specifying the System Type ========================== There may be some features `configure' can not figure out automatically, but needs to determine by the type of host the package will run on. Usually `configure' can figure that out, but if it prints a message saying it can not guess the host type, give it the `--host=TYPE' option. TYPE can either be a short name for the system type, such as `sun4', or a canonical name with three fields: CPU-COMPANY-SYSTEM See the file `config.sub' for the possible values of each field. If `config.sub' isn't included in this package, then this package doesn't need to know the host type. If you are building compiler tools for cross-compiling, you can also use the `--target=TYPE' option to select the type of system they will produce code for and the `--build=TYPE' option to select the type of system on which you are compiling the package. Sharing Defaults ================ If you want to set default values for `configure' scripts to share, you can create a site shell script called `config.site' that gives default values for variables like `CC', `cache_file', and `prefix'. `configure' looks for `PREFIX/share/config.site' if it exists, then `PREFIX/etc/config.site' if it exists. Or, you can set the `CONFIG_SITE' environment variable to the location of the site script. A warning: not all `configure' scripts look for a site script. Operation Controls `configure' recognizes the following options to control how it operates. `--cache-file=FILE' Use and save the results of the tests in FILE instead of `./config.cache'. Set FILE to `/dev/null' to disable caching, for debugging `configure'. `--help' Print a summary of the options to `configure', and exit. `--quiet' `--silent' `-q' Do not print messages saying which checks are being made. To suppress all normal output, redirect it to `/dev/null' (any error messages will still be shown). `--srcdir=DIR' Look for the package's source code in directory DIR. Usually `configure' can determine that directory automatically. `--version' Print the version of Autoconf used to generate the `configure' script, and exit. `configure' also accepts some other, not widely useful, options. Platform Specific Notes ======================= * Linux: With kernels 2.2.x and higher you may get `snort [pid] uses obsolete (PF_INET, SOCK_PACKET)' warnings. This is because you use some older implementation of libpcap library and you need an upgrade. The recent version of libpcap could be found at page. On linux with kernels 2.2.x and higher you may also get feature to monitor several interfaces down to network level (session + TCP + IP) if you link your snort with the lattest version of libpcap which incorporates Sebastian Krahmer's patch for interface 'any'. (Consult for details). * IRIX [ noticed by Scott A. McIntyre There's problem with GCC on IRIX platform which causes certain missbehaviour of snort. >From the SGI web site: Gcc does not correctly pass/return structures which are smaller than 16 bytes and which are not 8 bytes. The problem is very involved and difficult to fix. It affects a number of other targets also, but irix6 is affected the most, because it is a 64 bit target, and 4 byte structures are common. The exact problem is that structures are being padded at the wrong end, e.g. a 4 byte structure is loaded into the lower 4 bytes of the register when it should be loaded into the upper 4 bytes of the register. Gcc is consistent with itself, but not consistent with the SGI C compiler [and the SGI supplied runtime libraries], so the only failures that can happen are when there are library functions that take/return such structures. There are very few such library functions. I can only recall seeing a few of them: inet_ntoa, inet_aton, inet_lnaof, inet_netof, and semctl. A possible workaround: if you have a program that calls inet_ntoa and friends or semctl, and your kernel supports 64-bit binaries (i.e. uname -a prints IRIX64 rather than just IRIX), then you may compile with gcc -mabi=64 to workaround this problem. More information is available at: * SunOS Similar problem with GCC has been noticed on SunOS4.x platforms which causes snort to SIGBUS at certain places. Please use naitive C compiler instead.
 : Bardziej złożone instalacje: The generic notes for putting this thing together are below. Here s the. short version. 1.) *** Make sure you have libpcap installed!!! *** 2.) ./configure. 3.) make. 4.) make install. 5.) Create a sample rules file (if you want to use rules, check out the. included snort.conf file) 6.) snort - 7.) If you ve used previous versions of Snort, you may need to rewrite your. rules to make them compliant to the rules format. See. snort_manual.pdf or for more information. 8.) Have fun! Any questions Sign up to the snort-users mailing list at Snort Configure-time switches. ============================= `--enable-debug Enable debugging options (bugreports and developers only). `--with-snmp Enable SNMP alerting code. `--enable-flexresp Enable the Flexible Response code, that allows you to. cancel hostile connections on IP-level when a rule matches. When you enable this feature, you also need the libnet -library. that can be found at See README.FLEXRESP for details. This function is still ALPHA, so use with caution. `--with-mysql=DIR Support for mysql, turn this on if you want to use ACID with MySQL. `--with-odbc=DIR Support for ODBC databases, turn this on if you want to use ACID with a. non-listed DB. `--with-postgresql=DIR Support for Postgresql databases, turn this on if you want to use ACID with. PostgreSQL. `--with-oracle=DIR Support for Oracle databases, turn this on if you want to use ACID with. Oracle. `--with-openssl=DIR Support for openssl (used by the XML output plugin). `--with-libpq-includes=DIR Set the include directories for Postgres SQL database support to DIR. `--with-libpq-libraries=DIR Set the library directories for Postgres SQL database support to DIR. Setting both of these values enables the Postgres output plugin module. `--with-libpcap-includes=DIR If the configuration script can t find the libpcap include files on its. own, the path can be set manually with this switch. `--with-libpcap-libraries=DIR If the configuration script can t find the libpcap library files on its. `--with-libxml2-includes=DIR Libxml2 include directory. `--with-libxml2-libraries=DIR Libxml2 library directory. `--with-libntp-libraries=DIR Libntp library directory. `--with-libidmef-includes=DIR Libidmef include directory. `--with-libidmef-libraries=DIR Libidmef library directory. Basic Installation. ================== These are generic installation instructions. The `configure shell script attempts to guess correct values for. various system-dependent variables used during compilation. It uses. those values to create a `Makefile in each directory of the package. It may also create one or more `.h files containing system-dependent. definitions. Finally, it creates a shell script `config.status that. you can run in the future to recreate the current configuration, a file. `config.cache that saves the results of its tests to speed up. reconfiguring, and a file `config.log containing compiler output. (useful mainly for debugging `configure ). If you need to do unusual things to compile the package, please try. to figure out how `configure could check whether to do them, and mail. diffs or instructions to the address given in the `README so they can. be considered for the next release. If at some point `config.cache contains results you don t want to keep, you may remove or edit it. The file `configure.in is used to create `configure by a program. called `autoconf . You only need `configure.in if you want to change. it or regenerate `configure using a newer version of `autoconf . The simplest way to compile this package is: 1. `cd to the directory containing the package s source code and type. `./configure to configure the package for your system. If you re. using `csh on an old version of System V, you might need to type. `sh ./configure instead to prevent `csh from trying to execute. `configure itself. Running `configure takes awhile. While running, it prints some. messages telling which features it is checking for. 2. Type `make to compile the package. 3. Optionally, type `make check to run any self-tests that come with. the package. 4. Type `make install to install the programs and any data files and. documentation. 5. You can remove the program binaries and object files from the. source code directory by typing `make clean . To also remove the. files that `configure created (so you can compile the package for. a different kind of computer), type `make distclean . There is. also a `make maintainer-clean target, but that is intended mainly. for the package s developers. If you use it, you may have to get. all sorts of other programs in order to regenerate files that came. with the distribution. Compilers and Options. ===================== Some systems require unusual options for compilation or linking that. the `configure script does not know about. You can give `configure initial values for variables by setting them in the environment. Using. a Bourne-compatible shell, you can do that on the command line like. this: CC=c89 CFLAGS=-O2 LIBS=-lposix ./configure. Or on systems that have the `env program, you can do it like this: env CPPFLAGS=-I/usr/local/include LDFLAGS=-s ./configure. Compiling For Multiple Architectures. ==================================== You can compile the package for more than one kind of computer at the. same time, by placing the object files for each architecture in their. own directory. To do this, you must use a version of `make that. supports the `VPATH variable, such as GNU `make . `cd to the. directory where you want the object files and executables to go and run. the `configure script. `configure automatically checks for the. source code in the directory that `configure is in and in `.. . If you have to use a `make that does not supports the `VPATH variable, you have to compile the package for one architecture at a time. in the source code directory. After you have installed the package for. one architecture, use `make distclean before reconfiguring for another. architecture. Installation Names. By default, `make install will install the package s files in. `/usr/local/bin , `/usr/local/man , etc. You can specify an. installation prefix other than `/usr/local by giving `configure the. option `--prefix=PATH . You can specify separate installation prefixes for. architecture-specific files and architecture-independent files. If you. give `configure the option `--exec-prefix=PATH , the package will use. PATH as the prefix for installing programs and libraries. Documentation and other data files will still use the regular prefix. In addition, if you use an unusual directory layout you can give. options like `--bindir=PATH to specify different values for particular. kinds of files. Run `configure --help for a list of the directories. you can set and what kinds of files go in them. If the package supports it, you can cause programs to be installed. with an extra prefix or suffix on their names by giving `configure the. option `--program-prefix=PREFIX or `--program-suffix=SUFFIX . Optional Features. ================= Some packages pay attention to `--enable-FEATURE options to. `configure , where FEATURE indicates an optional part of the package. They may also pay attention to `--with-PACKAGE options, where PACKAGE. is something like `gnu-as or `x (for the X Window System). The. `README should mention any `--enable- and `--with- options that the. package recognizes. For packages that use the X Window System, `configure can usually. find the X include and library files automatically, but if it doesn t, you can use the `configure options `--x-includes=DIR and. `--x-libraries=DIR to specify their locations. The following configuration switches are available for Snort: Specifying the System Type. ========================== There may be some features `configure can not figure out. automatically, but needs to determine by the type of host the package. will run on. Usually `configure can figure that out, but if it prints. a message saying it can not guess the host type, give it the. `--host=TYPE option. TYPE can either be a short name for the system. type, such as `sun4 , or a canonical name with three fields: CPU-COMPANY-SYSTEM. See the file `config.sub for the possible values of each field. If. `config.sub isn t included in this package, then this package doesn t. need to know the host type. If you are building compiler tools for cross-compiling, you can also. use the `--target=TYPE option to select the type of system they will. produce code for and the `--build=TYPE option to select the type of. system on which you are compiling the package. Sharing Defaults. ================ If you want to set default values for `configure scripts to share, you can create a site shell script called `config.site that gives. default values for variables like `CC , `cache_file , and `prefix . `configure looks for `PREFIX/share/config.site if it exists, then. `PREFIX/etc/config.site if it exists. Or, you can set the. `CONFIG_SITE environment variable to the location of the site script. A warning: not all `configure scripts look for a site script. Operation Controls. `configure recognizes the following options to control how it. operates. `--cache-file=FILE Use and save the results of the tests in FILE instead of. `./config.cache . Set FILE to `/dev/null to disable caching, for. debugging `configure . `--help Print a summary of the options to `configure , and exit. `--quiet `--silent `-q Do not print messages saying which checks are being made. To. suppress all normal output, redirect it to `/dev/null (any error. messages will still be shown). `--srcdir=DIR Look for the package s source code in directory DIR. Usually. `configure can determine that directory automatically. `--version Print the version of Autoconf used to generate the `configure script, and exit. `configure also accepts some other, not widely useful, options. Platform Specific Notes. ======================= * Linux: With kernels 2.2.x and higher you may get `snort [pid] uses obsolete (PF_INET, SOCK_PACKET) warnings. This is because you use some older implementation of. libpcap library and you need an upgrade. The recent version of libpcap could be found at page. On linux with kernels 2.2.x and higher you may also get feature to. monitor several interfaces down to network level (session + TCP + IP) if you. link your snort with the lattest version of libpcap which incorporates. Sebastian Krahmer s patch for interface any . (Consult for details). * IRIX. [ noticed by Scott A. McIntyre There s problem with GCC on IRIX platform which causes certain missbehaviour. of snort. >From the SGI web site: Gcc does not correctly pass/return structures which are smaller than 16. bytes and which are. not 8 bytes. The problem is very involved and difficult to fix. It affects a number of other targets also, but irix6 is affected. the most, because it is a 64 bit target, and 4 byte structures. are common. The exact problem is that structures are being. padded at the wrong end, e.g. a 4 byte structure is loaded into. the lower 4 bytes of the register when it should be loaded. into the upper 4 bytes of the register. Gcc is consistent with itself, but not consistent with the SGI. C compiler [and the SGI supplied runtime libraries], so the. only failures that can happen are when there are library. functions that take/return such structures. There are very few. such library functions. I can only recall seeing a few of them: inet_ntoa, inet_aton, inet_lnaof, inet_netof, and semctl. A possible workaround: if you have a program that calls. inet_ntoa and friends or semctl, and your kernel supports. 64-bit binaries (i.e. uname -a prints IRIX64 rather than just. IRIX), then you may compile with gcc -mabi=64 to. workaround this problem. More information is available at: * SunOS. Similar problem with GCC has been noticed on SunOS4.x platforms which causes. snort to SIGBUS at certain places. Please use naitive C compiler instead.")
31
Snort – tryby pracy Sniffer Mode Packet Logger Mode
Network Intrusion Detection Mode Inline Mode

32
Sniffer Mode Nagłówki IP i TCP/UDP/ICMP Nagłówki i zawartość pakietów
./snort –v Nagłówki i zawartość pakietów ./snort –vd Nagłówki IP, zawartość pakietów, nagłówki łącza danych ./snort -vde First, let's start with the basics. If you just want to print out the TCP/IP packet headers to the screen (i.e. sniffer mode), try this: ./snort -v This command will run Snort and just show the IP and TCP/UDP/ICMP headers, nothing else. If you want to see the application data in transit, try the following: ./snort -vd This instructs Snort to display the packet data as well as the headers. If you want an even more descriptive display, showing the data link layer headers, do this: ./snort -vde (As an aside, these switches may be divided up or smashed together in any combination. The last command could also be typed out as: ./snort -d -v -e and it would do the same thing.)
, try this: ./snort -v This command will run Snort and just show the IP and TCP/UDP/ICMP headers, nothing else. If you want to see the application data in transit, try the following: ./snort -vd This instructs Snort to display the packet data as well as the headers. If you want an even more descriptive display, showing the data link layer headers, do this: ./snort -vde (As an aside, these switches may be divided up or smashed together in any combination. The last command could also be typed out as: ./snort -d -v -e and it would do the same thing.)")
33
Packet Logger Logowanie pakietów ./snort -dev -l ./log
Hierarchia katalogów a sieć lokalna ./snort -dev -l ./log -h /24 Logowanie w formacie binarnym ./snort -l ./log -b „Playback” ./snort -dv -r packet.log Filtr BPF ./snort -dvr packet.log icmp 1.3 Packet Logger Mode OK, all of these commands are pretty cool, but if you want to record the packets to the disk, you need to specify a logging directory and Snort will automatically know to go into packet logger mode: ./snort -dev -l ./log Of course, this assumes you have a directory named log in the current directory. If you don't, Snort will exit with an error message. When Snort runs in this mode, it collects every packet it sees and places it in a directory hierarchy based upon the IP address of one of the hosts in the datagram. If you just specify a plain -l switch, you may notice that Snort sometimes uses the address of the remote computer as the directory in which it places packets and sometimes it uses the local host address. In order to log relative to the home network, you need to tell Snort which network is the home network: ./snort -dev -l ./log -h /24 This rule tells Snort that you want to print out the data link and TCP/IP headers as well as application data into the directory ./log, and you want to log the packets relative to the class C network. All incoming packets will be recorded into subdirectories of the log directory, with the directory names being based on the address of the remote (non ) host. Note: Note that if both the source and destination hosts are on the home network, they are logged to a directory with a name based on the higher of the two port numbers or, in the case of a tie, the source address. If you're on a high speed network or you want to log the packets into a more compact form for later analysis, you should consider logging in binary mode. Binary mode logs the packets in tcpdump format to a single binary file in the logging directory: ./snort -l ./log -b Note the command line changes here. We don't need to specify a home network any longer because binary mode logs everything into a single file, which eliminates the need to tell it how to format the output directory structure. Additionally, you don't need to run in verbose mode or specify the -d or -e switches because in binary mode the entire packet is logged, not just sections of it. All you really need to do to place Snort into logger mode is to specify a logging directory at the command line using the -l switch--the -b binary logging switch merely provides a modifier that tells Snort to log the packets in something other than the default output format of plain ASCII text. Once the packets have been logged to the binary file, you can read the packets back out of the file with any sniffer that supports the tcpdump binary format (such as tcpdump or Ethereal). Snort can also read the packets back by using the -r switch, which puts it into playback mode. Packets from any tcpdump formatted file can be processed through Snort in any of its run modes. For example, if you wanted to run a binary log file through Snort in sniffer mode to dump the packets to the screen, you can try something like this: ./snort -dv -r packet.log You can manipulate the data in the file in a number of ways through Snort's packet logging and intrusion detection modes, as well as with the BPF interface that's available from the command line. For example, if you only wanted to see the ICMP packets from the log file, simply specify a BPF filter at the command line and Snort will only see the ICMP packets in the file: ./snort -dvr packet.log icmp For more info on how to use the BPF interface, read the Snort and tcpdump man pages.
 host. Note: Note that if both the source and destination hosts are on the home network, they are logged to a directory with a name based on the higher of the two port numbers or, in the case of a tie, the source address. If you re on a high speed network or you want to log the packets into a more compact form for later analysis, you should consider logging in binary mode. Binary mode logs the packets in tcpdump format to a single binary file in the logging directory: ./snort -l ./log -b. Note the command line changes here. We don t need to specify a home network any longer because binary mode logs everything into a single file, which eliminates the need to tell it how to format the output directory structure. Additionally, you don t need to run in verbose mode or specify the -d or -e switches because in binary mode the entire packet is logged, not just sections of it. All you really need to do to place Snort into logger mode is to specify a logging directory at the command line using the -l switch--the -b binary logging switch merely provides a modifier that tells Snort to log the packets in something other than the default output format of plain ASCII text. Once the packets have been logged to the binary file, you can read the packets back out of the file with any sniffer that supports the tcpdump binary format (such as tcpdump or Ethereal). Snort can also read the packets back by using the -r switch, which puts it into playback mode. Packets from any tcpdump formatted file can be processed through Snort in any of its run modes. For example, if you wanted to run a binary log file through Snort in sniffer mode to dump the packets to the screen, you can try something like this: ./snort -dv -r packet.log. You can manipulate the data in the file in a number of ways through Snort s packet logging and intrusion detection modes, as well as with the BPF interface that s available from the command line. For example, if you only wanted to see the ICMP packets from the log file, simply specify a BPF filter at the command line and Snort will only see the ICMP packets in the file: ./snort -dvr packet.log icmp For more info on how to use the BPF interface, read the Snort and tcpdump man pages.")
34
Barnyard Umożliwia efektywny zapis na dysku – odciąża główny proces Snort-a Monitoruje binarne pliki logów Snort-a i konwertuje je do różnych formatów Trzy tryby przetwarzania: „one shot” Ciągły(continual) Ciągły z punktami kontrolnymi (continual w/checkpoint) * Introduction Barnyard has 3 modes of operation: One-shot, continual, continual w/ checkpoint. In one-shot mode, barnyard will process the specified file and exit. In continual mode, barnyard will start with the specified file and continue to process new data (and new spool files) as it appears. Continual mode w/ checkpointing will also use a checkpoint file (or waldo file in the snort world) to track where it is. In the event the barnyard process ends while a waldo file is in use, barnyard will resume processing at the last entry as listed in the waldo file. The "-f", "-w", and "-o" options are used to determine which mode barnyard will run in. It is legal for both the "-f" and "-w" options to be used on the command line at the same time, however any data that exists in the waldo file will override the command line data from the "-d", "-f", and "-s" options. See the command directives section below for more detail. Barnyard processing is controlled by two main types of directives: Input processors and output plugins. The input processors read information in from a specific format ( currently the spo_unified output module of Snort ) and output them in one of several ways. Barnyard allows Snort to write to disk in an efficient manner and leaves the task of parsing binary data into various formats to a separate process that will not cause Snort to miss network traffic. * Input Processors - Alert The dp_alert data processor is capable of reading the alert (event) format generated by Snort's spo_unified plug-in. It is used with output plug-ins that support the "alert" input type. Alerts are the high-level data associated with a specific event such as source and destination ip and port and rule id. This plug-in takes no arguments. Syntax: processor dp_alert - Log The dp_log data processor is capable of reading the log format generated by Snort's spo_unified plug-in. It is used with output plug-ins that support the "log" input type. Log information is the raw packets that are captured with a tag option, log rule, or the data that set off a specific event. processor dp_log * Output Processors - Alert Fast This output processor converts data from the dp_alert plugin into an approximation of Snort's "fast alert" mode. output alert_fast - Log dump The log_dump processor converts data from the dp_log plugin into human readable packet dumps output log_dump * Command line directives By default, barnyard will run in continual mode without checkpointing. Checkpointing can be enabled with the "-w" option. One-shot mode is enabled with the "-o" option. NOTE: When running in one-shot mode, you MUST NOT specify the "-t" or "-w" options. -a <archive directory> This option enables automated archiving of spool files after they have been processed. The argument specifies the directory the spool files will be moved to. Do not use this option if you have multiple instances of barnyard processing the same set of spool files. **THIS OPTION HAS NOT YET BEEN IMPLEMENTED** -c <conffile> This option specifies the configuration file to use -d <spool directory> This option specifies the directory to read spool files from. The default is "/var/log/snort". -f <spool_file> This option specifies the base name of the spool file in continual mode. If "one-shot" mode has been enabled, this is the file that will be processed. -g <filename> Set the generator names file. This file maps snort preprocessor alert messages with specific preprocessor events -h or -? This option displays the usage data and exits. -o This option enables one-shot mode. This is a one-time pass through the spool file that will end when the end of the file has been reached -s <filename> Specify the sid map file. The sid map correlates snort id's with the specific alert message -t <time_t for extension> The spool files created by the unified output plugin have an extension of the time (in seconds since epoch) when the file was created. This option specifies the minimum time value for the first file to be processed. The file with a time extension greater than or equal to this value will be the first file processed. Older files will be ignored. The default is 0. -w <waldo file> This option both enables checkpointing and specifies the name of the checkpoint file to use. A waldo file allows barnyard to keep track of the last point of file processing for growing log files. -L <filepath> Specify the output log dir and file. -R Dry run mode. This process parses the commandline and config files, displays the parsed configuration and exits. This is useful for debugging problems. Example Usage: Uses the configuration files in /etc/snort ( the default locations ) and monitors the /var/log/snort directory and monitoris the snort.alert* files. barnyard -c /etc/snort/barnyard.conf \ -d /var/log/snort -g /etc/snort/gen-msg.map \ -s /etc/snort/sid-msg.map -f snort.alert ================================================================================ Signal Handling Barnyard recognizes several signals. The following identifies those signals for which barnyard has handlers installed and the actions taken on those signals. SIGHUP - reload configuration SIGINT - clean exit SIGQUIT - clean exit SIGTERM - clean exit
 Ciągły z punktami kontrolnymi (continual w/checkpoint) * Introduction. Barnyard has 3 modes of operation: One-shot, continual, continual w/ checkpoint. In one-shot mode, barnyard will process the specified file and exit. In continual mode, barnyard will start with the specified file and continue to process. new data (and new spool files) as it appears. Continual mode w/ checkpointing will also use a checkpoint file (or waldo file in the. snort world) to track where it is. In the event the barnyard process. ends while a waldo file is in use, barnyard will resume processing at. the last entry as listed in the waldo file. The -f , -w , and -o options are used to determine which mode. barnyard will run in. It is legal for both the -f and -w options. to be used on the command line at the same time, however any data that. exists in the waldo file will override the command line data from the. -d , -f , and -s options. See the command directives section. below for more detail. Barnyard processing is controlled by two main types of directives: Input processors and output plugins. The input processors read. information in from a specific format ( currently the spo_unified. output module of Snort ) and output them in one of several ways. Barnyard allows Snort to write to disk in an efficient manner and. leaves the task of parsing binary data into various formats to a. separate process that will not cause Snort to miss network traffic. * Input Processors. - Alert. The dp_alert data processor is capable of reading the alert (event) format generated by Snort s spo_unified plug-in. It is used with. output plug-ins that support the alert input type. Alerts are the. high-level data associated with a specific event such as source and. destination ip and port and rule id. This plug-in takes no arguments. Syntax: processor dp_alert. - Log. The dp_log data processor is capable of reading the log format. generated by Snort s spo_unified plug-in. It is used with output. plug-ins that support the log input type. Log information is the. raw packets that are captured with a tag option, log rule, or the data. that set off a specific event. processor dp_log. * Output Processors. - Alert Fast. This output processor converts data from the dp_alert plugin into an. approximation of Snort s fast alert mode. output alert_fast. - Log dump. The log_dump processor converts data from the dp_log plugin. into human readable packet dumps. output log_dump. * Command line directives. By default, barnyard will run in continual mode without checkpointing. Checkpointing can be enabled with the -w option. One-shot mode is. enabled with the -o option. NOTE: When running in one-shot mode, you MUST NOT specify the -t or -w options. -a <archive directory> This option enables automated archiving of spool files after. they have been processed. The argument specifies the directory. the spool files will be moved to. Do not use this option if you. have multiple instances of barnyard processing the same set of. spool files. **THIS OPTION HAS NOT YET BEEN IMPLEMENTED** -c <conffile> This option specifies the configuration file to use. -d <spool directory> This option specifies the directory to read spool files from. The default is /var/log/snort . -f <spool_file> This option specifies the base name of the spool file in continual. mode. If one-shot mode has been enabled, this is the file that. will be processed. -g <filename> Set the generator names file. This file maps snort. preprocessor alert messages with specific preprocessor events. -h or - This option displays the usage data and exits. -o. This option enables one-shot mode. This is a one-time pass. through the spool file that will end when the end of the file. has been reached. -s <filename> Specify the sid map file. The sid map correlates snort id s. with the specific alert message. -t <time_t for extension> The spool files created by the unified output plugin have an. extension of the time (in seconds since epoch) when the file was. created. This option specifies the minimum time value for the. first file to be processed. The file with a time extension. greater than or equal to this value will be the first file. processed. Older files will be ignored. The default is 0. -w <waldo file> This option both enables checkpointing and specifies the. name of the checkpoint file to use. A waldo file allows. barnyard to keep track of the last point of file processing. for growing log files. -L <filepath> Specify the output log dir and file. -R. Dry run mode. This process parses the commandline and config files, displays the parsed configuration and exits. This is useful for. debugging problems. Example Usage: Uses the configuration files in /etc/snort ( the default locations ) and monitors the /var/log/snort directory and monitoris the. snort.alert* files. barnyard -c /etc/snort/barnyard.conf \ -d /var/log/snort -g /etc/snort/gen-msg.map \ -s /etc/snort/sid-msg.map -f snort.alert. ================================================================================ Signal Handling. Barnyard recognizes several signals. The following identifies those signals for. which barnyard has handlers installed and the actions taken on those signals. SIGHUP - reload configuration. SIGINT - clean exit. SIGQUIT - clean exit. SIGTERM - clean exit.")
35
Network Intrusion Detection Mode
Tryb detekcji prób włamań ./snort -dev -l ./log -h /24 -c snort.conf Przełącznik –v powinien zostać pominięty przy zastosowaniach produkcyjnych (groźba utraty pakietów) Logowanie nagłówków warstwy łącza danych też jest zbędne ./snort -d -l ./log -h /24 -c snort.conf Alert: -A none|full|fast|unsock|cmg|console Logowanie do syslog-a: -s ./snort -c snort.conf -A fast -h /24 Kolejność reguł: -o najpierw Pass, a potem Alert 1.4 Network Intrusion Detection Mode To enable Network Intrusion Detection (NIDS) mode so that you don't record every single packet sent down the wire, try this: ./snort -dev -l ./log -h /24 -c snort.conf where snort.conf is the name of your rules file. This will apply the rules configured in the snort.conf file to each packet to decide if an action based upon the rule type in the file should be taken. If you don't specify an output directory for the program, it will default to /var/log/snort. One thing to note about the last command line is that if Snort is going to be used in a long term way as an IDS, the -v switch should be left off the command line for the sake of speed. The screen is a slow place to write data to, and packets can be dropped while writing to the display. It's also not necessary to record the data link headers for most applications, so you can usually omit the -e switch, too. ./snort -d -h /24 -l ./log -c snort.conf This will configure Snort to run in its most basic NIDS form, logging packets that trigger rules specified in the snort.conf in plain ASCII to disk using a hierarchical directory structure (just like packet logger mode). 1.4.1 NIDS Mode Output Options There are a number of ways to configure the output of Snort in NIDS mode. The default logging and alerting mechanisms are to log in decoded ASCII format and use full alerts. The full alert mechanism prints out the alert message in addition to the full packet headers. There are several other alert output modes available at the command line, as well as two logging facilities. Alert modes are somewhat more complex. There are seven alert modes available at the command line: full, fast, socket, syslog, console, cmg, and none. Six of these modes are accessed with the -A command line switch. These options are: OptionDescription-A fast Fast alert mode. Writes the alert in a simple format with a timestamp, alert message, source and destination IPs/ports. -A full Full alert mode. This is the default alert mode and will be used automatically if you do not specify a mode. -A unsock Sends alerts to a UNIX socket that another program can listen on. -A none Turns off alerting. -A console Sends ``fast-style'' alerts to the console (screen). -A cmg Generates ``cmg style'' alerts. Packets can be logged to their default decoded ASCII format or to a binary log file via the -b command line switch. To disable packet logging altogether, use the -N command line switch. For output modes available through the configuration file, see Section 2.7. Note: Command line logging options override any output options specified in the configuration file. This allows debugging of configuration issues quickly via the command line. To send alerts to syslog, use the -s switch. The default facilities for the syslog alerting mechanism are LOG_AUTHPRIV and LOG_ALERT. If you want to configure other facilities for syslog output, use the output plugin directives in the rules files. See Section for more details on configuring syslog output. For example, use the following command line to log to default (decoded ASCII) facility and send alerts to syslog: ./snort -c snort.conf -l ./log -h /24 -s As another example, use the following command line to log to the default facility in /var/log/snort and send alerts to a fast alert file: ./snort -c snort.conf -A fast -h /24 1.4.2 Understanding Standard Alert Output When Snort generates an alert message, it will usually look like the following: [**] [116:56:1] (snort_decoder): T/TCP Detected [**] The first number is the Generator ID, this tells the user what component of Snort generated this alert. For a list of GIDs, please read etc/generators in the Snort source. In this case, we know that this event came from the ``decode'' (116) component of Snort. The second number is the Snort ID (sometimes referred to as Signature ID). For a list of preprocessor SIDs, please see etc/gen-msg.map. Rule-based SIDs are written directly into the rules with the "sid" option. In this case, ``56'' represents a T/TCP event. The third number is the revision ID. This number is primarily used when writing signatures, as each rendition of the rule should increment this number with the ``rev'' option. 1.4.3 High Performance Configuration If you want Snort to go fast (like keep up with a 1000 Mbps connection), you need to use unified logging and a unified log reader such as barnyard. This allows Snort to log alerts in a binary form as fast as possible while another program performs the slow actions, such as writing to a database. If you want a text file that's easily parsable, but still somewhat fast, try using binary logging with the ``fast'' output mechanism. This will log packets in tcpdump format and produce minimal alerts. For example: ./snort -b -A fast -c snort.conf 1.4.4 Changing Alert Order The default way in which Snort applies its rules to packets may not be appropriate for all installations. The Alert rules are applied first, then the Pass rules, and finally, Log rules are applied. This sequence is somewhat counterintuitive, but it's a more foolproof method than allowing a user to write a hundred alert rules that are then disabled by an errant pass rule. For more information on rule types, see Section If you know what you're doing, you can use the -o switch to change the default rule application behavior to apply Pass rules, then Alert rules, then Log rules: ./snort -d -h /24 -l ./log -c snort.conf -o
 Logowanie nagłówków warstwy łącza danych też jest zbędne. ./snort -d -l ./log -h /24 -c snort.conf. Alert: -A none|full|fast|unsock|cmg|console. Logowanie do syslog-a: -s. ./snort -c snort.conf -A fast -h /24. Kolejność reguł: -o najpierw Pass, a potem Alert. 1.4 Network Intrusion Detection Mode. To enable Network Intrusion Detection (NIDS) mode so that you don t record every single packet sent down the wire, try this: ./snort -dev -l ./log -h /24 -c snort.conf where snort.conf is the name of your rules file. This will apply the rules configured in the snort.conf file to each packet to decide if an action based upon the rule type in the file should be taken. If you don t specify an output directory for the program, it will default to /var/log/snort. One thing to note about the last command line is that if Snort is going to be used in a long term way as an IDS, the -v switch should be left off the command line for the sake of speed. The screen is a slow place to write data to, and packets can be dropped while writing to the display. It s also not necessary to record the data link headers for most applications, so you can usually omit the -e switch, too. ./snort -d -h /24 -l ./log -c snort.conf This will configure Snort to run in its most basic NIDS form, logging packets that trigger rules specified in the snort.conf in plain ASCII to disk using a hierarchical directory structure (just like packet logger mode) NIDS Mode Output Options. There are a number of ways to configure the output of Snort in NIDS mode. The default logging and alerting mechanisms are to log in decoded ASCII format and use full alerts. The full alert mechanism prints out the alert message in addition to the full packet headers. There are several other alert output modes available at the command line, as well as two logging facilities. Alert modes are somewhat more complex. There are seven alert modes available at the command line: full, fast, socket, syslog, console, cmg, and none. Six of these modes are accessed with the -A command line switch. These options are: OptionDescription-A fast. Fast alert mode. Writes the alert in a simple format with a timestamp, alert message, source and destination IPs/ports. -A full. Full alert mode. This is the default alert mode and will be used automatically if you do not specify a mode. -A unsock. Sends alerts to a UNIX socket that another program can listen on. -A none. Turns off alerting. -A console. Sends ``fast-style alerts to the console (screen). -A cmg. Generates ``cmg style alerts. Packets can be logged to their default decoded ASCII format or to a binary log file via the -b command line switch. To disable packet logging altogether, use the -N command line switch. For output modes available through the configuration file, see Section 2.7. Note: Command line logging options override any output options specified in the configuration file. This allows debugging of configuration issues quickly via the command line. To send alerts to syslog, use the -s switch. The default facilities for the syslog alerting mechanism are LOG_AUTHPRIV and LOG_ALERT. If you want to configure other facilities for syslog output, use the output plugin directives in the rules files. See Section for more details on configuring syslog output. For example, use the following command line to log to default (decoded ASCII) facility and send alerts to syslog: ./snort -c snort.conf -l ./log -h /24 -s As another example, use the following command line to log to the default facility in /var/log/snort and send alerts to a fast alert file: ./snort -c snort.conf -A fast -h / Understanding Standard Alert Output. When Snort generates an alert message, it will usually look like the following: [**] [116:56:1] (snort_decoder): T/TCP Detected [**] The first number is the Generator ID, this tells the user what component of Snort generated this alert. For a list of GIDs, please read etc/generators in the Snort source. In this case, we know that this event came from the ``decode (116) component of Snort. The second number is the Snort ID (sometimes referred to as Signature ID). For a list of preprocessor SIDs, please see etc/gen-msg.map. Rule-based SIDs are written directly into the rules with the sid option. In this case, ``56 represents a T/TCP event. The third number is the revision ID. This number is primarily used when writing signatures, as each rendition of the rule should increment this number with the ``rev option High Performance Configuration. If you want Snort to go fast (like keep up with a 1000 Mbps connection), you need to use unified logging and a unified log reader such as barnyard. This allows Snort to log alerts in a binary form as fast as possible while another program performs the slow actions, such as writing to a database. If you want a text file that s easily parsable, but still somewhat fast, try using binary logging with the ``fast output mechanism. This will log packets in tcpdump format and produce minimal alerts. For example: ./snort -b -A fast -c snort.conf Changing Alert Order. The default way in which Snort applies its rules to packets may not be appropriate for all installations. The Alert rules are applied first, then the Pass rules, and finally, Log rules are applied. This sequence is somewhat counterintuitive, but it s a more foolproof method than allowing a user to write a hundred alert rules that are then disabled by an errant pass rule. For more information on rule types, see Section If you know what you re doing, you can use the -o switch to change the default rule application behavior to apply Pass rules, then Alert rules, then Log rules: ./snort -d -h /24 -l ./log -c snort.conf -o.")
36
Inline Mode Iptables (libipq) zamiast libpcap
Wymaga LibNet ( Trzy typy reguł drop reject sdrop (bez logowania) 1.5 Inline Mode Snort RC1 integrated the intrusion prevention system (IPS) capability of snort_inline into the official Snort project. Snort_inline obtains packets from iptables instead of libpcap and then uses new rule types to help iptables pass or drop packets based on Snort rules. In order for snort_inline to work properly, you must download and compile the iptables code to include ``make install-devel'' ( This will install the libipq library that allows snort_inline to interface with iptables. Also, you must build and install LibNet, which is available from There are three rule types you can use when running Snort with snort_inline: drop - The drop rule type will tell iptables to drop the packet and log it via usual Snort means. reject - The reject rule type will tell iptables to drop the packet, log it via usual Snort means, and send a TCP reset if the protocol is TCP or an icmp port unreachable if the protocol is UDP. sdrop - The sdrop rule type will tell iptables to drop the packet. Nothing is logged. Note: You can also replace sections of the packet payload when using snort_inline. See Section for more information. When using a reject rule, there are two options you can use to send TCP resets: You can use a RAW socket (the default behavior for snort_inline), in which case you must have an interface that has an IP address assigned to it. If there is not an interface with an IP address assigned with access to the source of the packet, the packet will be logged and the reset packet will never make it onto the network. You can also now perform resets via a physical device when using iptables. We take the indev name from ip_queue and use this as the interface on which to send resets. We no longer need an IP loaded on the bridge, and can remain pretty stealthy as the config layer2_resets in snort_inline.conf takes a source MAC address which we substitue for the MAC of the bridge. For example: config layer2resets tells snort_inline to use layer2 resets and uses the MAC address of the bridge as the source MAC in the packet, and: config layer2resets: 00:06:76:DD:5F:E3 will tell snort_inline to use layer2 resets and uses the source MAC of 00:06:76:DD:5F:E3 in the reset packet. 1.5.1 Snort Inline Rule Application Order The current rule application order is: ->activation->dynamic->drop->sdrop->reject->alert->pass->log This will ensure that a drop rule has precedence over an alert or log rule. You can use the -o flag to the rule application order to: ->activation->dynamic->pass->drop->sdrop->reject->alert->log 1.5.2 New STREAM4 Options for Use with Snort Inline When using snort_inline, you can use two additional stream4 options: inline_state (no arguments) This option causes Snort to drop TCP packets that are not associated with an existing TCP session, and is not a valid TCP initiator. midstream_drop_alerts (no arguments) By default, when running in inline mode, Snort will silently drop any packets that were picked up in midstream and would have caused an alert to be generated, if not for the 'flow: established' option. This is to mitigate stick/snot type attacks when the user hasn't enabled inline_state. If you want to see the alerts that are silently dropped, enable this keyword. Note that by enabling this keyword, you have opened yourself up to stick/snot-type attacks. For more information about Stream4, see Section 1.5.3 Replacing Packets with Snort Inline Additionally, Jed Haile's content replace code allows you to modify packets before they leave the network. For example: alert tcp any any <> any 80 (msg: "tcp replace"; content:"GET"; replace:"BET";) alert udp any any <> any 53 (msg: "udp replace"; \ content: "yahoo"; replace: "xxxxx";) These rules will comb tcp port 80 traffic looking for GET, and udp port 53 traffic looking for yahoo. Once they are found, they are replaced with BET and xxxxx, respectively. The only catch is that the replace must be the same length as the content. 1.5.4 Installing Snort Inline To install Snort inline, use the following command: ./configure --enable-inline make make install 1.5.5 Running Snort Inline First, you need to ensure that the ip_queue module is loaded. Then, you need to send traffic to snort_inline using the QUEUE target. For example, iptables -A OUTPUT -p tcp --dport 80 -j QUEUE sends all TCP traffic leaving the firewall going to port 80 to the QUEUE target. This is what sends the packet from kernel space to user space (snort_inline). A quick way to get all outbound traffic going to the QUEUE is to use the rc.firewall script created and maintained by the Honeynet Project ( This script is well-documented and allows you to direct packets to snort_inline by simply changing the QUEUE variable to yes. Finally, start snort_inline. snort_inline -QDc ../etc/drop.conf -l /var/log/snort You can use the following command line options: -Q - Gets packets from iptables. -D - Runs snort_inline in daemon mode. The process ID is stored at /var/run/snort_inline.pid -c - Reads the following configuration file. -l - Logs to the following directory. Ideally, snort_inline will be run using only its own drop.rules. If you want to use Snort for just alerting, a separate process should be running with its own ruleset. 1.5.6 Using the Honeynet Snort Inline Toolkit The Honeynet Snort Inline Toolkit is a statically compiled snort_inline binary put together by the Honeynet Project for the Linux operating system. It comes with a set of drop.rules, the snort_inline binary, a snort-inline rotation shell script, and a good README. It can be found at: 1.5.7 Troubleshooting Snort Inline If you run snort_inline and see something like this: Initializing Output Plugins! Reading from iptables Log directory = /var/log/snort Initializing Inline mode InlineInit: : Failed to send netlink message: Connection refused More than likely, the ip_queue module is not loaded or ip_queue support is not compiled into your kernel. Either recompile your kernel to support ip_queue, or load the module. The ip_queue module is loaded by executing: insmod ip_queue Also, if you want to ensure snort_inline is getting packets, you can start it in the following manner: snort_inline -Qvc <configuration file> This will display the header of every packet that snort_inline sees. Kolejność reguł ->activation->dynamic->drop->sdrop->reject->alert->pass->log z opcją –o: ->activation->dynamic->pass->drop->sdrop-> reject->alert->log Zmiana zawartości pakietu, STREAM4
 Inline Mode. Snort RC1 integrated the intrusion prevention system (IPS) capability of snort_inline into the official Snort project. Snort_inline obtains packets from iptables instead of libpcap and then uses new rule types to help iptables pass or drop packets based on Snort rules. In order for snort_inline to work properly, you must download and compile the iptables code to include ``make install-devel ( This will install the libipq library that allows snort_inline to interface with iptables. Also, you must build and install LibNet, which is available from There are three rule types you can use when running Snort with snort_inline: drop - The drop rule type will tell iptables to drop the packet and log it via usual Snort means. reject - The reject rule type will tell iptables to drop the packet, log it via usual Snort means, and send a TCP reset if the protocol is TCP or an icmp port unreachable if the protocol is UDP. sdrop - The sdrop rule type will tell iptables to drop the packet. Nothing is logged. Note: You can also replace sections of the packet payload when using snort_inline. See Section for more information. When using a reject rule, there are two options you can use to send TCP resets: You can use a RAW socket (the default behavior for snort_inline), in which case you must have an interface that has an IP address assigned to it. If there is not an interface with an IP address assigned with access to the source of the packet, the packet will be logged and the reset packet will never make it onto the network. You can also now perform resets via a physical device when using iptables. We take the indev name from ip_queue and use this as the interface on which to send resets. We no longer need an IP loaded on the bridge, and can remain pretty stealthy as the config layer2_resets in snort_inline.conf takes a source MAC address which we substitue for the MAC of the bridge. For example: config layer2resets tells snort_inline to use layer2 resets and uses the MAC address of the bridge as the source MAC in the packet, and: config layer2resets: 00:06:76:DD:5F:E3 will tell snort_inline to use layer2 resets and uses the source MAC of 00:06:76:DD:5F:E3 in the reset packet Snort Inline Rule Application Order. The current rule application order is: ->activation->dynamic->drop->sdrop->reject->alert->pass->log This will ensure that a drop rule has precedence over an alert or log rule. You can use the -o flag to the rule application order to: ->activation->dynamic->pass->drop->sdrop->reject->alert->log New STREAM4 Options for Use with Snort Inline. When using snort_inline, you can use two additional stream4 options: inline_state (no arguments) This option causes Snort to drop TCP packets that are not associated with an existing TCP session, and is not a valid TCP initiator. midstream_drop_alerts (no arguments) By default, when running in inline mode, Snort will silently drop any packets that were picked up in midstream and would have caused an alert to be generated, if not for the flow: established option. This is to mitigate stick/snot type attacks when the user hasn t enabled inline_state. If you want to see the alerts that are silently dropped, enable this keyword. Note that by enabling this keyword, you have opened yourself up to stick/snot-type attacks. For more information about Stream4, see Section Replacing Packets with Snort Inline. Additionally, Jed Haile s content replace code allows you to modify packets before they leave the network. For example: alert tcp any any <> any 80 (msg: tcp replace ; content: GET ; replace: BET ;) alert udp any any <> any 53 (msg: udp replace ; \ content: yahoo ; replace: xxxxx ;) These rules will comb tcp port 80 traffic looking for GET, and udp port 53 traffic looking for yahoo. Once they are found, they are replaced with BET and xxxxx, respectively. The only catch is that the replace must be the same length as the content Installing Snort Inline. To install Snort inline, use the following command: ./configure --enable-inline make make install Running Snort Inline. First, you need to ensure that the ip_queue module is loaded. Then, you need to send traffic to snort_inline using the QUEUE target. For example, iptables -A OUTPUT -p tcp --dport 80 -j QUEUE sends all TCP traffic leaving the firewall going to port 80 to the QUEUE target. This is what sends the packet from kernel space to user space (snort_inline). A quick way to get all outbound traffic going to the QUEUE is to use the rc.firewall script created and maintained by the Honeynet Project ( This script is well-documented and allows you to direct packets to snort_inline by simply changing the QUEUE variable to yes. Finally, start snort_inline. snort_inline -QDc ../etc/drop.conf -l /var/log/snort You can use the following command line options: -Q - Gets packets from iptables. -D - Runs snort_inline in daemon mode. The process ID is stored at /var/run/snort_inline.pid. -c - Reads the following configuration file. -l - Logs to the following directory. Ideally, snort_inline will be run using only its own drop.rules. If you want to use Snort for just alerting, a separate process should be running with its own ruleset Using the Honeynet Snort Inline Toolkit. The Honeynet Snort Inline Toolkit is a statically compiled snort_inline binary put together by the Honeynet Project for the Linux operating system. It comes with a set of drop.rules, the snort_inline binary, a snort-inline rotation shell script, and a good README. It can be found at: Troubleshooting Snort Inline. If you run snort_inline and see something like this: Initializing Output Plugins! Reading from iptables Log directory = /var/log/snort Initializing Inline mode InlineInit: : Failed to send netlink message: Connection refused More than likely, the ip_queue module is not loaded or ip_queue support is not compiled into your kernel. Either recompile your kernel to support ip_queue, or load the module. The ip_queue module is loaded by executing: insmod ip_queue Also, if you want to ensure snort_inline is getting packets, you can start it in the following manner: snort_inline -Qvc <configuration file> This will display the header of every packet that snort_inline sees. Kolejność reguł. ->activation->dynamic->drop->sdrop->reject->alert->pass->log. z opcją –o: ->activation->dynamic->pass->drop->sdrop-> reject->alert->log. Zmiana zawartości pakietu, STREAM4.")
37
Konfiguracja Snort-a Snort.conf Adresy sieci Tryb uruchomienia
Katalog z regułami Nazwy plików z regułami Katalog logowania Tryb logowania

38
Architektura Snort-a Packet Stream Sniffing Packet Decoder Data Flow
Preprocessor (Plug-ins) Detection Engine Output Stage Packet Stream Sniffing Data Flow Alerts/Logs
 Detection Engine. Output Stage. Packet Stream. Sniffing. Data Flow. Alerts/Logs.")
39
Moduł detekcji alert tcp Sip: 1.1.1.1 Dip: 2.2.2.2 Dp: 80
(flags: A+; content: “”foo”;) (flags: A+; content: “bar”;) (flags: A+; content: “baz”;)
 (flags: A+; content: bar ;) (flags: A+; content: baz ;)")
40
System reguł Dwie sekcje reguły nagłówek reguły (rule header):
alert tcp ! /24 any -> /24 any (flags: SF; msg: “SYN-FIN Scan”;) Dwie sekcje reguły nagłówek reguły (rule header): alert tcp ! /24 any -> /24 any opcje reguły (rule options): (flags: SF; msg: “SYN-FIN Scan”;) Nagłówki i opcje mogą być łączone w dowolnych kombinacjach Budowa reguły Rule headers and options can be strung together in any combination
 Dwie sekcje reguły. nagłówek reguły (rule header): alert tcp ! /24 any -> /24 any. opcje reguły (rule options): (flags: SF; msg: SYN-FIN Scan ;) Nagłówki i opcje mogą być łączone w dowolnych kombinacjach. Budowa reguły. Rule headers and options can be strung together in any combination.")
41
Nagłówek reguły Typ Adres Port Kierunek Aktywowanie/dynamiczne

42
Nagłówek reguły-typy alert – generuje alert przy użyciu wybranej metody i zapisuje pakiet w logu log – zapisuje pakiet w pliku logu pass – ignoruje pakiet activate – wygenerowanie alertu i aktywacja reguły dynamicznej dynamic – reguła pozostaje nieaktywna do momentu aktywacji przez inną regułę – po czym działa jak reguła log drop powoduje odrzucenie przez iptables pakietu i zapisanie go w logu reject – powoduje odrzucenie (drop) przez iptables pakietu i zapisanie go w logu, a następnie wysyła TCP reset, albo ICMP „port nieosiągalny” (port unreachable) sdrop – powoduje, że iptables odrzuca pakiet (drop), ale go nie loguje Nagłówek reguły
 przez iptables pakietu i zapisanie go w logu, a następnie wysyła TCP reset, albo ICMP „port nieosiągalny (port unreachable) sdrop – powoduje, że iptables odrzuca pakiet (drop), ale go nie loguje. Nagłówek reguły.")
43
Opcje reguł (1) meta-data payload non-payload post-detection
Opcje dostarczające informacji o regule, ale nie mające znaczenia w trakcie detekcji payload Opcje powodujące sprawdzanie zawartości pakietów - mogą być wewnętrznie powiązane (inter-related) non-payload Opcje sprawdzające nagłówki pakietów i tym podobne (non-payload data) post-detection „rule specific triggers” (uruchamiane po „odpaleniu” reguły) Payload Nonpayload Kilka słów kluczowych
 non-payload. Opcje sprawdzające nagłówki pakietów i tym podobne (non-payload data) post-detection. „rule specific triggers (uruchamiane po „odpaleniu reguły) Payload. Nonpayload. Kilka słów kluczowych.")
44
Opcje reguł(2) IP TTL IP ID Fragment size TCP Flags TCP Ack number
TCP Seq number Payload size Content Content offset Content depth Session recording ICMP type ICMP code Alternate log files 3.3 Rule Options Rule options form the heart of Snort's intrusion detection engine, combining ease of use with power and flexibility. All Snort rule options are separated from each other using the semicolon (;) character. Rule option keywords are separated from their arguments with a colon (:) character. There are four major categories of rule options. meta-data These options provide information about the rule but do not have any affect during detection payload These options all look for data inside the packet payload and can be inter-related non-payload These options look for non-payload data post-detection These options are rule specific triggers that happen after a rule has ``fired.''
 character. Rule option keywords are separated from their arguments with a colon (:) character. There are four major categories of rule options. meta-data. These options provide information about the rule but do not have any affect during detection. payload. These options all look for data inside the packet payload and can be inter-related. non-payload. These options look for non-payload data. post-detection. These options are rule specific triggers that happen after a rule has ``fired.")
45
Przykładowe reguły (1) alert tcp ![ /24, /24] any -> \ [ /24, /24] 111 (content: "| a5|"; \ msg: "external mountd access";) log udp any any -> /24 1:1024 log udp log tcp any any -> /24 :6000 log tcp any :1024 -> /24 500: log tcp any any -> /24 !6000:6010 (loguje wszystko oprócz Xwindows)
![Przykładowe reguły (1) alert tcp ![ /24, /24] any -> \ [ /24, /24] 111 (content: | a5| ; \](http://slideplayer.pl/slide/63042/1/images/45/Przyk%C5%82adowe+regu%C5%82y+%281%29+alert+tcp+%21%5B+%2F24%2C+%2F24%5D+any+-%3E+%5C+%5B+%2F24%2C+%2F24%5D+111+%28content%3A+%7C+a5%7C+%3B+%5C.jpg "msg: external mountd access ;) log udp any any -> /24 1:1024 log udp. log tcp any any -> /24 :6000. log tcp any :1024 -> /24 500: log tcp any any -> /24 !6000:6010 (loguje wszystko oprócz Xwindows)")
46
Przykładowe reguły (2) activate tcp !$HOME_NET any -> $HOME_NET 143 (flags: PA; \ content: "|E8C0FFFFFF|/bin"; activates: 1; \ msg: "IMAP buffer overflow!";) dynamic tcp !$HOME_NET any -> $HOME_NET 143 \ (activated_by: 1; count: 50;) alert tcp any any <> /24 80 (content: "bad.htm"; \ msg: "Not for children!"; react: block, msg;) Opcja react: block - close connection and send the visible notice warn - send the visible, warning notice (will be available soon) alert tcp any any -> any 23 (flags:s,12; tag:session,10,seconds;)
 dynamic tcp !$HOME_NET any -> $HOME_NET 143 \ (activated_by: 1; count: 50;) alert tcp any any <> /24 80 (content: bad.htm ; \ msg: Not for children! ; react: block, msg;) Opcja react: block - close connection and send the visible notice. warn - send the visible, warning notice (will be available soon) alert tcp any any -> any 23 (flags:s,12; tag:session,10,seconds;)")
47
Przykładowe reguły (3) Standalone Thresholds
Limit logging to 1 event per 60 seconds: threshold gen_id 1, sig_id 1851, type limit, track by_src, \ count 1, seconds 60 Limit logging to every 3rd event: threshold gen_id 1, sig_id 1852, type threshold, track by_src, \ count 3, seconds 60 Limit logging to just 1 event per 60 seconds, but only if we exceed 30 events in 60 seconds: threshold gen_id 1, sig_id 1853, type both, track by_src, \ count 30, seconds 60

48
Przykładowe reguły(4) Rule Thresholds
This rule logs the rst event of this SID every 60 seconds. alert tcp $external_net any -> $http_servers $http_ports \ (msg:"web-misc robots.txt access"; flow:to_server, established; \ uricontent:"/robots.txt"; nocase; reference:nessus,10302; \ classtype:web-application-activity; threshold: type limit, track \ by_src, count 1 , seconds 60 ; sid: ; rev:1;)
")
49
Przykładowe alerty (1) [**] [1:2517:13] IMAP PCT Client_Hello overflow attempt [**] [Classification: Attempted Administrator Privilege Gain] [Priority: 1] 11/17-13:48: :90:F5:29:32:3F -> 0:4:96:1B:BF:C0 type:0x800 len:0x76 : > :993 TCP TTL:64 TOS:0x0 ID:33172 IpLen:20 DgmLen:104 DF ***AP*** Seq: 0xBF224CAF Ack: 0x3952E434 Win: 0xF8E0 TcpLen: 32 TCP Options (3) => NOP NOP TS: [Xref => => =>
![Przykładowe alerty (1) [**] [1:2517:13] IMAP PCT Client_Hello overflow attempt [**]](http://slideplayer.pl/slide/63042/1/images/49/Przyk%C5%82adowe+alerty+%281%29+%5B%2A%2A%5D+%5B1%3A2517%3A13%5D+IMAP+PCT+Client_Hello+overflow+attempt+%5B%2A%2A%5D.jpg "[Classification: Attempted Administrator Privilege Gain] [Priority: 1] 11/17-13:48: :90:F5:29:32:3F -> 0:4:96:1B:BF:C0 type:0x800 len:0x : > :993 TCP TTL:64 TOS:0x0 ID:33172 IpLen:20 DgmLen:104 DF. ***AP*** Seq: 0xBF224CAF Ack: 0x3952E434 Win: 0xF8E0 TcpLen: 32. TCP Options (3) => NOP NOP TS: [Xref => => name= ][Xref =>")
50
Przykładowe alerty (2)
")
51
Agenda Trochę teorii Analiza i korelacja danych
Snort – standard de facto Wizualizacje i raporty Aplikacje zarządzające Podsumowanie Ogólny outline prezentacji. Co zostanie zasygnalizowane w prezentacji

52
Narzędzia do wizualizacji
SnortALog ACID BASE SnortReport Inne Inne – jakie?

53
SnortALog (1) Tworzy raporty w plikach HTML, PDF i tekstowych
Generuje grafiki w formacie GIF, PNG lub JPG w przypadku raportów w HTML CLI (Command Line Interface) i GUI (Graphic User Interface) Współpracuje z logami Syslog-a, obsługuje alerty Snort-a w trybach Fast i Full
 i GUI (Graphic User Interface) Współpracuje z logami Syslog-a, obsługuje alerty Snort-a w trybach Fast i Full.")
54
SnortALog (2) Works with all Snort preprocessor (spp_stream4, spp_portscan, spp_decoder, flow, flow-portscan ...) Has the possibility to link the Snort signature to the web reference attack description Works with "-I" Snort option to specify an interface and add report Works now with "-e" Snort option (Display the second layer header info) Uses a specific plugin for generating your own reference Snort rules Works with all SNORT preprocessor (spp_stream4, spp_portscan, spp_decoder, flow, flow-portscan ...) Has the possibility to link the SNORT signature to the web reference attack description Works with "-I" Snort option to specify an interface and add report Works now with "-e" Snort option (Display the second layer header info) Uses a specific plugin for generating your own reference SNORT rules
 Uses a specific plugin for generating your own reference Snort rules. Works with all SNORT preprocessor (spp_stream4, spp_portscan, spp_decoder, flow, flow-portscan ...) Has the possibility to link the SNORT signature to the web reference attack description. Works with -I Snort option to specify an interface and add report. Works now with -e Snort option (Display the second layer header info) Uses a specific plugin for generating your own reference SNORT rules.")
55
SnortALog (3) Can specify order (ascending or descending)
Can specify the number of occurrences to view Can resolve IP addresses and domains Add colors for the best visibility Possibility to do filtering (if you only want a specific IP source or high severity snort logs)
")
56
SnortALog (4) Works with CheckPoint Fw-1 (4.1 and NG) in syslog and fw logexport command Works now with CheckPoint Fw-1 SmartDefense Works with Netfilter and IPFilter syslog logs Works with Netfilter and PFilter syslog logs Works now with syslog CISCO PIX logs (Thanks to Edwin) Works on Windows box (basic option: no graph) Works with Lucent Brick Firewall logs
 Works on Windows box (basic option: no graph) Works with Lucent Brick Firewall logs.")
57
SnortALog instalacja Sprawdzamy, czy mamy wymagane biblioteki grafika:
GD-1.19.tar.gz do generacji wykresów w formacie Gif GDGraph-1.39.tar.gz GDTextUtil-0.85.tar.gz generacji raportów w PDF: htmldoc source.tar.gz HTML-HTMLDoc-0.07.tar.gz GUI : Moduły i kod Tk dla Perl/Tk. Tk tar.gz perl-Tk i386.rpm baza Whois: Net-Whois-IP-0.50.tar.gz Dependencies Please to check out the perl prerequisites librairies for : Generate charts : Else, it's not necessary to have specifics librairies to run Snortalog. Configuration Check out the these points if you want to make the script working fine. Perl binaries You need to specify the PATH of the PERL binary at the first line of the script as chown below. Example : #!/usr/bin/perl $domains_file If you want to use "-c" option to have a domain report, you need to specify the PATH of the domains file. If you are not interrested by this report, disable the line with a "#". $rules_file If you want or need to have HTML link in your attack report, you need to specify the PATH of the rules file, else you can disable it with a "#". If necessary, you can add, modify or delete everything you want in the file $domains_file and $rules_file. The only things to do is to respect the existing format. Usage You need to redirect the log file to my program as shown by the following shell command : cat logs.file | ./snortalog.pl -r -n 50 Why I did I not ask for a specific file name ? Just for one reason (but a smart one :-). For daily logs rotation, I'm using the file name format file_yyyymmdd.log (Year, Month and Day). So it's easy for me to generate daily, weekly, monthly and yearly report without any file renaming operations. The following options are available : -x Mode GUI -r Resolve IP adresses -w Consult Whois DataBase (Slow down process) -c Resolve domains (Very slow process) -i Inverse the result -d Mode debug -n Specify a number of line in the result -l Specify an output language -o Specify a HTML or PDF file -g Graph output format -file Specify an input alert log file -rulesfile Specify name and directory to search rules file -hwfile Specify name and directory to search hardware file -domainsfile Specify name and directory to search domains file -langfile Specify name and directory to search language file -pictsdir Specify directory to search HTML pictures files -genref Generate the reference rules file -help View this help The following reports are available : -src Top IPs sources -dst Top IPs destination -src_attack Top IPs sources grouped by attack -dst_attack Top IPs destination grouped by attack -src_dst_attack Top alert grouped by IPs sources, Ips destination and attack -attack Top attack -class Top classification -severity Top severity -daily_event Top number of attack grouped by day -hour Top number of attack grouped by hour -hour_attack Top specific attack grouped by hour -dport Top destination port -proto Top usage of protocole -dport_attack Top destination port grouped by attack -nids Top NIDS host -interfaces Top interfaces events -domain_src Top of domain source -portscan Top of portscan alert -actions Top of firewall action (DROP, REJECT, ACCEPT, etc ...) -rules Top number of DROP by rule (only Fw-1) -reasons Top number of DROP reason (only Fw-1) -src_dport Top IPs sources grouped by destination port -dst_dport Top IPs destination grouped by destination port -report All reports The following filters are available : -fsrc Sources filter -fdst Destination filter -fproto Protocole filter -fdport Destination port filter -fmonth Month filter -fday Day filter -fhour Hour filter -fether Interface filter -fseverity Severity filter -faction Firewall action filter -frule Firewall rule filter -frule Firewall rule filter -ftype Type of logs -fclass Snort Alert Classification filter The following input logs are available : -1 Fast Snort's output log -2 Syslog Snort's output log -3 Full Snort's ouput log -4 CheckPoint Fw-1's fwm logexport log -5 CheckPoint Fw-1's syslog log -6 Pix's log -7 IPFilter's log -8 NetFilter's log -9 Barnyard's syslog log -10 PacketFilter's log -11 Brick's export log -12 Barnyard's fast log Examples # cat snort*.rules | ./snortalog.pl -genref refsigtxt SnortALog will generate a referenced rules file from your Snort rules or your own signatures. # cat file.logs | ./snortalog.pl -r -n 30 -report SnortALog will generate a report in ASCII format with address resolution and a maximum of 30 occurences for all reports. # cat file.logs | ./snortalog.pl -n 30 -report -fether eth1 SnortALog will generate a report in ASCII format with interface filter # cat file.logs | ./snortalog.pl -r -n 30 -dst_attack SnortALog will generate a report in ASCII format with address resolution and a maximum number of 30 occurences for the report dst_attack. # cat file.logs | ./snortalog.pl -r -i -h file.html -report SnortALog will generate a report in HTML format stored in file.html with address resolution and display the result from least frequent to most frequent occurences (reverse mode). # cat file.logs | ./snortalog.pl -r -g gif -h /tmp/file.html -report Same as the previous example but with Gif graphs and in a specific directorie. # cat file.logs | ./snortalog.pl -i -n 30 -report | /usr/sbin/sendmail -f SnortALog will generate a report in ASCII format with reverse request, and a maximum number of 30 occurences and send the result by mail. # cat file_200212[1-7] | ./snortalog.pl -report SnortALog will genrerate a report in ASCII format with all events of the first week of December (between the 1st and 7th). # cat file_20021* | ./snortalog.pl -report SnortALog will genrerate a report in ASCII format with all events of the three last months of the year 2002 (month 10, 11 and 12). Operation If you want to make daily reports, il will be better to generate them from the switched logfile at night. You can also configure your crontab to send, automatically, a report to the administrator by 0 4 * * * user cat logs.file | ./snortalog.pl -r -n 50 -report | /usr/sbin/sendmail -f
. For daily logs rotation, I m using the file name format file_yyyymmdd.log (Year, Month and Day). So it s easy for me to generate daily, weekly, monthly and yearly report without any file renaming operations. The following options are available : -x Mode GUI -r Resolve IP adresses -w Consult Whois DataBase (Slow down process) -c Resolve domains (Very slow process) -i Inverse the result -d Mode debug -n Specify a number of line in the result -l Specify an output language -o Specify a HTML or PDF file -g Graph output format -file Specify an input alert log file -rulesfile Specify name and directory to search rules file -hwfile Specify name and directory to search hardware file -domainsfile Specify name and directory to search domains file -langfile Specify name and directory to search language file -pictsdir. Specify directory to search HTML pictures files -genref Generate the reference rules file -help View this help. The following reports are available : -src Top IPs sources -dst Top IPs destination -src_attack Top IPs sources grouped by attack -dst_attack Top IPs destination grouped by attack -src_dst_attack Top alert grouped by IPs sources, Ips destination and attack -attack Top attack -class Top classification -severity Top severity -daily_event Top number of attack grouped by day -hour Top number of attack grouped by hour -hour_attack Top specific attack grouped by hour -dport Top destination port -proto Top usage of protocole -dport_attack Top destination port grouped by attack -nids Top NIDS host -interfaces Top interfaces events -domain_src Top of domain source -portscan Top of portscan alert -actions Top of firewall action (DROP, REJECT, ACCEPT, etc ...) -rules Top number of DROP by rule (only Fw-1) -reasons Top number of DROP reason (only Fw-1) -src_dport Top IPs sources grouped by destination port -dst_dport Top IPs destination grouped by destination port -report All reports. The following filters are available : -fsrc Sources filter -fdst Destination filter -fproto Protocole filter -fdport Destination port filter -fmonth Month filter -fday Day filter -fhour Hour filter -fether Interface filter -fseverity Severity filter -faction Firewall action filter -frule Firewall rule filter -frule Firewall rule filter -ftype Type of logs -fclass Snort Alert Classification filter. The following input logs are available : -1 Fast Snort s output log -2 Syslog Snort s output log -3 Full Snort s ouput log -4 CheckPoint Fw-1 s fwm logexport log -5 CheckPoint Fw-1 s syslog log -6 Pix s log -7 IPFilter s log -8 NetFilter s log -9 Barnyard s syslog log -10 PacketFilter s log -11 Brick s export log -12 Barnyard s fast log. Examples. # cat snort*.rules | ./snortalog.pl -genref refsigtxt. SnortALog will generate a referenced rules file from your Snort rules or your own signatures. # cat file.logs | ./snortalog.pl -r -n 30 -report. SnortALog will generate a report in ASCII format with address resolution and a maximum of 30 occurences for all reports. # cat file.logs | ./snortalog.pl -n 30 -report -fether eth1. SnortALog will generate a report in ASCII format with interface filter. # cat file.logs | ./snortalog.pl -r -n 30 -dst_attack. SnortALog will generate a report in ASCII format with address resolution and a maximum number of 30 occurences for the report dst_attack. # cat file.logs | ./snortalog.pl -r -i -h file.html -report. SnortALog will generate a report in HTML format stored in file.html with address resolution and display the result from least frequent to most frequent occurences (reverse mode). # cat file.logs | ./snortalog.pl -r -g gif -h /tmp/file.html -report. Same as the previous example but with Gif graphs and in a specific directorie. # cat file.logs | ./snortalog.pl -i -n 30 -report | /usr/sbin/sendmail -f SnortALog will generate a report in ASCII format with reverse request, and a maximum number of 30 occurences and send the result by mail. # cat file_200212[1-7] | ./snortalog.pl -report. SnortALog will genrerate a report in ASCII format with all events of the first week of December (between the 1st and 7th). # cat file_20021* | ./snortalog.pl -report. SnortALog will genrerate a report in ASCII format with all events of the three last months of the year 2002 (month 10, 11 and 12). Operation. If you want to make daily reports, il will be better to generate them from the switched logfile at night. You can also configure your crontab to send, automatically, a report to the administrator by * * * user cat logs.file | ./snortalog.pl -r -n 50 -report | /usr/sbin/sendmail -f")
58
SnortALog instalacja(1)
Pobieramy źródła: wget /snortalog/snortalog_v2.4.0.tgz linux# tar –zxvf snortalog_v2.4.0.tgz cd snortalog_v2.4.0 ./configure make make install

59
SnortALog (opcje) cat logs.file | ./snortalog.pl -r –c –o raport.html –g jpg –report Opcje: -x Mode GUI -r Resolve IP adresses -w Consult Whois DataBase (Slow down process) -c Resolve domains (Very slow process) -i Inverse the result -n Specify a number of line in the result -l Specify an output language -o Specify a HTML or PDF file -g Graph output format -file Specify an input alert log file ... Raporty: -report -src -dport -hour_attack Usage You need to redirect the log file to my program as shown by the following shell command : cat logs.file | ./snortalog.pl -r -n 50 Why I did I not ask for a specific file name ? Just for one reason (but a smart one :-). For daily logs rotation, I'm using the file name format file_yyyymmdd.log (Year, Month and Day). So it's easy for me to generate daily, weekly, monthly and yearly report without any file renaming operations. The following options are available : -x Mode GUI -r Resolve IP adresses -w Consult Whois DataBase (Slow down process) -c Resolve domains (Very slow process) -i Inverse the result -d Mode debug -n Specify a number of line in the result -l Specify an output language -o Specify a HTML or PDF file -g Graph output format -file Specify an input alert log file -rulesfile Specify name and directory to search rules file -hwfile Specify name and directory to search hardware file -domainsfile Specify name and directory to search domains file -langfile Specify name and directory to search language file -pictsdir Specify directory to search HTML pictures files -genref Generate the reference rules file -help View this help The following reports are available : -src Top IPs sources -dst Top IPs destination -src_attack Top IPs sources grouped by attack -dst_attack Top IPs destination grouped by attack -src_dst_attack Top alert grouped by IPs sources, Ips destination and attack -attack Top attack -class Top classification -severity Top severity -daily_event Top number of attack grouped by day -hour Top number of attack grouped by hour -hour_attack Top specific attack grouped by hour -dport Top destination port -proto Top usage of protocole -dport_attack Top destination port grouped by attack -nids Top NIDS host -interfaces Top interfaces events -domain_src Top of domain source -portscan Top of portscan alert -actions Top of firewall action (DROP, REJECT, ACCEPT, etc ...) -rules Top number of DROP by rule (only Fw-1) -reasons Top number of DROP reason (only Fw-1) -src_dport Top IPs sources grouped by destination port -dst_dport Top IPs destination grouped by destination port -report All reports The following filters are available : -fsrc Sources filter -fdst Destination filter -fproto Protocole filter -fdport Destination port filter -fmonth Month filter -fday Day filter -fhour Hour filter -fether Interface filter -fseverity Severity filter -faction Firewall action filter -frule Firewall rule filter -frule Firewall rule filter -ftype Type of logs -fclass Snort Alert Classification filter The following input logs are available : -1 Fast Snort's output log -2 Syslog Snort's output log -3 Full Snort's ouput log -4 CheckPoint Fw-1's fwm logexport log -5 CheckPoint Fw-1's syslog log -6 Pix's log -7 IPFilter's log -8 NetFilter's log -9 Barnyard's syslog log -10 PacketFilter's log -11 Brick's export log -12 Barnyard's fast log Examples # cat snort*.rules | ./snortalog.pl -genref refsigtxt SnortALog will generate a referenced rules file from your Snort rules or your own signatures. # cat file.logs | ./snortalog.pl -r -n 30 -report SnortALog will generate a report in ASCII format with address resolution and a maximum of 30 occurences for all reports. # cat file.logs | ./snortalog.pl -n 30 -report -fether eth1 SnortALog will generate a report in ASCII format with interface filter # cat file.logs | ./snortalog.pl -r -n 30 -dst_attack SnortALog will generate a report in ASCII format with address resolution and a maximum number of 30 occurences for the report dst_attack. # cat file.logs | ./snortalog.pl -r -i -h file.html -report SnortALog will generate a report in HTML format stored in file.html with address resolution and display the result from least frequent to most frequent occurences (reverse mode). # cat file.logs | ./snortalog.pl -r -g gif -h /tmp/file.html -report Same as the previous example but with Gif graphs and in a specific directorie. # cat file.logs | ./snortalog.pl -i -n 30 -report | /usr/sbin/sendmail -f SnortALog will generate a report in ASCII format with reverse request, and a maximum number of 30 occurences and send the result by mail. # cat file_200212[1-7] | ./snortalog.pl -report SnortALog will genrerate a report in ASCII format with all events of the first week of December (between the 1st and 7th). # cat file_20021* | ./snortalog.pl -report SnortALog will genrerate a report in ASCII format with all events of the three last months of the year 2002 (month 10, 11 and 12).
 -c Resolve domains (Very slow process) -i Inverse the result. -n Specify a number of line in the result. -l Specify an output language. -o Specify a HTML or PDF file. -g Graph output format. -file Specify an input alert log file. ... Raporty: -report. -src. -dport. -hour_attack. Usage. You need to redirect the log file to my program as shown by the following shell command : cat logs.file | ./snortalog.pl -r -n 50. Why I did I not ask for a specific file name Just for one reason (but a smart one :-). For daily logs rotation, I m using the file name format file_yyyymmdd.log (Year, Month and Day). So it s easy for me to generate daily, weekly, monthly and yearly report without any file renaming operations. The following options are available : -x Mode GUI. -r Resolve IP adresses. -w Consult Whois DataBase (Slow down process) -c Resolve domains (Very slow process) -i Inverse the result. -d Mode debug. -n Specify a number of line in the result. -l Specify an output language. -o Specify a HTML or PDF file. -g Graph output format. -file Specify an input alert log file. -rulesfile Specify name and directory to search rules file. -hwfile Specify name and directory to search hardware file. -domainsfile Specify name and directory to search domains file. -langfile Specify name and directory to search language file -pictsdir. Specify directory to search HTML pictures files -genref Generate the reference rules file -help View this help. The following reports are available : -src Top IPs sources -dst Top IPs destination -src_attack Top IPs sources grouped by attack -dst_attack Top IPs destination grouped by attack -src_dst_attack Top alert grouped by IPs sources, Ips destination and attack -attack Top attack -class Top classification -severity Top severity -daily_event Top number of attack grouped by day -hour Top number of attack grouped by hour -hour_attack Top specific attack grouped by hour -dport Top destination port -proto Top usage of protocole -dport_attack Top destination port grouped by attack -nids Top NIDS host -interfaces Top interfaces events -domain_src Top of domain source -portscan Top of portscan alert -actions Top of firewall action (DROP, REJECT, ACCEPT, etc ...) -rules Top number of DROP by rule (only Fw-1) -reasons Top number of DROP reason (only Fw-1) -src_dport Top IPs sources grouped by destination port -dst_dport Top IPs destination grouped by destination port -report All reports. The following filters are available : -fsrc Sources filter -fdst Destination filter -fproto Protocole filter -fdport Destination port filter -fmonth Month filter -fday Day filter -fhour Hour filter -fether Interface filter -fseverity Severity filter -faction Firewall action filter -frule Firewall rule filter -frule Firewall rule filter -ftype Type of logs -fclass Snort Alert Classification filter. The following input logs are available : -1 Fast Snort s output log -2 Syslog Snort s output log -3 Full Snort s ouput log -4 CheckPoint Fw-1 s fwm logexport log -5 CheckPoint Fw-1 s syslog log -6 Pix s log -7 IPFilter s log -8 NetFilter s log -9 Barnyard s syslog log -10 PacketFilter s log -11 Brick s export log -12 Barnyard s fast log. Examples. # cat snort*.rules | ./snortalog.pl -genref refsigtxt. SnortALog will generate a referenced rules file from your Snort rules or your own signatures. # cat file.logs | ./snortalog.pl -r -n 30 -report. SnortALog will generate a report in ASCII format with address resolution and a maximum of 30 occurences for all reports. # cat file.logs | ./snortalog.pl -n 30 -report -fether eth1. SnortALog will generate a report in ASCII format with interface filter. # cat file.logs | ./snortalog.pl -r -n 30 -dst_attack. SnortALog will generate a report in ASCII format with address resolution and a maximum number of 30 occurences for the report dst_attack. # cat file.logs | ./snortalog.pl -r -i -h file.html -report. SnortALog will generate a report in HTML format stored in file.html with address resolution and display the result from least frequent to most frequent occurences (reverse mode). # cat file.logs | ./snortalog.pl -r -g gif -h /tmp/file.html -report. Same as the previous example but with Gif graphs and in a specific directorie. # cat file.logs | ./snortalog.pl -i -n 30 -report | /usr/sbin/sendmail -f SnortALog will generate a report in ASCII format with reverse request, and a maximum number of 30 occurences and send the result by mail. # cat file_200212[1-7] | ./snortalog.pl -report. SnortALog will genrerate a report in ASCII format with all events of the first week of December (between the 1st and 7th). # cat file_20021* | ./snortalog.pl -report. SnortALog will genrerate a report in ASCII format with all events of the three last months of the year 2002 (month 10, 11 and 12).")
60
Przykłady wizualizacji (1)
SnortALog raport

61
Agenda Trochę teorii Analiza i korelacja danych
Snort – standard de facto Wizualizacje i raporty Aplikacje zarządzające Podsumowanie Ogólny outline prezentacji. Co zostanie zasygnalizowane w prezentacji

62
Aplikacje zarządzające
SnortCenter IDS Policy Manager (Windows) /onlinehelp/idspm.htm IDScenter (Windows) HenWen (Mac OS X) About SnortCenter SnortCenter is a web-based client-server management system written in PHP and Perl. It will help you to configure Snort and keep the signatures up-to-date. The Management Console will build the configuration files for you and then send it to the remote sensor. Some features: SSL encryption between Management System and remote Sensor Agents. Build in user authentication. Automatic update / import new snort signatures from the internet and push them to the sensors. Start-Stop Snort remotely and push the specific configuration to the sensor. Create personal rules or modify the snort rules. Rule Templates support for easy configuring multiple sensors. Support for SnortSam One Sensor Agent can handle multiple snort daemons if the system has multiple network interfaces. Multi Language support (english, german, french, spanish, italian, dutch). Management Console and Sensor Agents for Linux, BSD, *NIX, Windows. About IDS Policy Manager IDS Policy Manager was written to manage Snort IDS sensors in a distributed environment. This is done by having the ability to take the text configuration and rule files and allow you to modify them with an easy to use graphical interface. With the added ability to merge new rule sets, manage preprocessors, configure output modules and scp rules to sensors. This tool makes managing snort easy for most security professionals. Some of the key features include: Graphical interface for easily manageability of snort rule and configuration files. Simply drag and drop to move rules around between groups or within a group. Merge new snort rules into existing rule files. Make quick changes to snort rules. Enable rules based on IP/Port. Search for rules based on just about any criteria. Update rules via the web. Easy to manage multiple sensors with multiple policy files. Upload/Download policy files via SCP. Test the rules from within the application with snort. Restart Sensors via SSH after upload. Full support for Snort. Easy to learn details about a signature from popular databases such as CVE, BugTraq, Mcafee, arachNIDS, Snort.org Reference. Database and custom URL's. Add rules easily by cut and paste or make your own custom signatures. Use custom upload scripts.
 /onlinehelp/idspm.htm. IDScenter (Windows) HenWen (Mac OS X) About SnortCenter SnortCenter is a web-based client-server management system written in PHP and Perl. It will help you to configure Snort and keep the signatures up-to-date. The Management Console will build the configuration files for you and then send it to the remote sensor. Some features: SSL encryption between Management System and remote Sensor Agents. Build in user authentication. Automatic update / import new snort signatures from the internet and push them to the sensors. Start-Stop Snort remotely and push the specific configuration to the sensor. Create personal rules or modify the snort rules. Rule Templates support for easy configuring multiple sensors. Support for SnortSam. One Sensor Agent can handle multiple snort daemons if the system has multiple network interfaces. Multi Language support (english, german, french, spanish, italian, dutch). Management Console and Sensor Agents for Linux, BSD, *NIX, Windows. About IDS Policy Manager. IDS Policy Manager was written to manage Snort IDS sensors in a distributed environment. This is done by having the ability to take the text configuration and rule files and allow you to modify them with an easy to use graphical interface. With the added ability to merge new rule sets, manage preprocessors, configure output modules and scp rules to sensors. This tool makes managing snort easy for most security professionals. Some of the key features include: Graphical interface for easily manageability of snort rule and configuration files. Simply drag and drop to move rules around between groups or within a group. Merge new snort rules into existing rule files. Make quick changes to snort rules. Enable rules based on IP/Port. Search for rules based on just about any criteria. Update rules via the web. Easy to manage multiple sensors with multiple policy files. Upload/Download policy files via SCP. Test the rules from within the application with snort. Restart Sensors via SSH after upload. Full support for Snort. Easy to learn details about a signature from popular databases such as CVE, BugTraq, Mcafee, arachNIDS, Snort.org Reference. Database and custom URL s. Add rules easily by cut and paste or make your own custom signatures. Use custom upload scripts.")
63
SnortCenter System zarządzania Agent (sensor agent)
SnortCenter is a web-based client-server management system written in PHP and Perl. It will help you to configure Snort and keep the signatures up-to-date. The Management Console will build the configuration files for you and then send it to the remote sensor. Some features: SSL encryption between Management System and remote Sensor Agents. Build in user authentication. Automatic update / import new snort signatures from the internet and push them to the sensors. Start-Stop Snort remotely and push the specific configuration to the sensor. Create personal rules or modify the snort rules. Rule Templates support for easy configuring multiple sensors. Support for SnortSam One Sensor Agent can handle multiple snort daemons if the system has multiple network interfaces. Multi Language support (english, german, french, spanish, italian, dutch). Management Console and Sensor Agents for Linux, BSD, *NIX, Windows.
. Management Console and Sensor Agents for Linux, BSD, *NIX, Windows.")
64
SnortCenter (1)
")
65
SnortCenter(2)
")
66
SnortCenter(3)
")
67
SnortCenter(4)
")
68
IDS Policy Manager (1)
")
69
IDS Policy Manager(2)
")
70
IDS Policy Manager(3)
")
71
IDS Policy Manager(4)
")
72
IDS Policy Manager(5)
")
73
IDS Policy Manager(6)
")
74
IDS Policy Manager(7)
")
75
IDS Policy Manager(8)
")
76
IDS Policy Manager(9)
")
77
IDS Policy Manager(10)
")
78
Podsumowanie DZIĘKUJĘ ZA UWAGĘ
Maciej Miłostan, cs.put.poznan.pl IDS a IPS – wykrywanie i zapobieganie... Analiza danych – czyli jak wykryć, że się coś dzieje, kiedy się dzieje... 3x Snort Snort=dobry i darmowy... Snort=wiele aplikacji... Snort=wciąż rozwijany... Wizualizacja=SnortALog Zarządzanie=IDS Policy Manager| |[SnortCenter] © Maciej Miłostan DZIĘKUJĘ ZA UWAGĘ

79
Bonus: Testowanie IDS-ów

Podobne prezentacje


