Pobierz prezentację
Pobieranie prezentacji. Proszę czekać

1
DMA

2
Historia DMA/DMTA 1983 Polymer Laboratories (UK) 1985 DuPont (USA)
Inni połowa lat 90-tych

3
DMA Dynamic Mechanical Analysis
Pomiar zmiany właściwości mechanicznych polimeru (moduł, tłumienie) w funkcji temperatury czasu naprężenia częstotliwości kombinacji tych parametrów
 w funkcji. temperatury. czasu. naprężenia. częstotliwości. kombinacji tych parametrów.")
4
DMA Można obserwować zachowanie materiału w temperaturach użytkowania, poddanego różnym obciążeniom lub obciążeniom zmieniającym się z różną częstotliwością Polimery zmienają sztywność i wytrzymałość z temperaturą. Na temperatury przejść fazowych ma wpływ częstotliwość Czasem temperatury przejść łatwiej wykryć stosując obciążenia mechaniczne

5
DMA

6
Obciążenia dynamiczne
Force (dynamic) Force F (static) Stress =FA Time Phase angle = d material response Amplitude = k Stress Strain =yo/y Time 92
 Force. F (static) Stress =FA. Time. Phase angle = d. material response. Amplitude = k. Stress. Strain =yo/y. Time. 92.")
7
DMA przesunięcie w fazie naprężenia i odkształcenia

8
DMA Tan d = E”/E’ E* = E’ + iE” E* δ E` E`` 94

9
DMA E* - moduł zespolony
E` - część rzeczywista - moduł zachowawczy - część materiału reagująca bez opóźnienia E`` - część urojona - moduł stratności - cześć materiału reagująca z opóźnieniem δ - przesunięcie fazowe - miara energii zużytej na zmiany uporządkowania

10
E” ~ energia utracona na ruchy wewnetrzne E’ ~ odpowiedź sprężysta

11
Polimery są ciałami lepkosprężystymi
zachowują się jak ciecz (faza amorficzna) i jednocześnie jak ciała sprężyste (krystality)
 i jednocześnie jak ciała sprężyste (krystality)")
12
Prawo Hook’a Sprężyna - element reagujący na naprężenie bez opóźnienia s e slope = k = Odkształcenie proporcjonalne do naprężenia 87

13
Prędkość płynięcia (przez otwory) jest proporcjonalna do naprężenia
Ciecze Newtonowskie s g . slope = h Prędkość płynięcia (przez otwory) jest proporcjonalna do naprężenia Tłok - podatność na płynięcie 88
 jest proporcjonalna do naprężenia. Tłok - podatność na płynięcie. 88.")
14
Polymers are Non-Newtonian Fluids!!!
At low shear rates, the viscosity is controlled by MW. The material shows Newtonian behavior Viscosity shows a linear dependence on rate above the ho region. At high rates, the material can no longer shear thin and a second plateau is reached. Zero Shear Plateau ~ ho Linear Dependence on Rate h Log Infinite Shear Plateau ~ h g . Log 89

15
Stress-Strain Curves Curvature is caused by the
viscous part of the polymer. 90

16
Ruchy łańcuchów obserwowane w DMA
Stretching Bending Rotating Coordinated movements Slippage

17
Wykres DMA E’ (6) g (5) (4) Tg - glass transition (3) a
Temperature Tm - melting (1) Rubbery Plateau (2) Tg - glass transition (3) a (4) (6) (5) (4) (3) (2) (1) local bend side gradual large chain motions and groups main scale slippage stretch chain chain 98
 Rubbery Plateau (2) Tg - glass transition (3) a. (4) (6) (5) (4) (3) (2) (1) local bend side gradual large chain. motions and groups main scale slippage. stretch chain chain. 98.")
18
Log Modulus (Pa) G l a s y R u b e r C o - i n k d f M c U S 5 6 7 8 9
Very Hard Hard Pliable Soft Very Soft Flowing 5 6 7 8 9 1 G l a s y R u b e r C o - i n k d T m p t A B D E f M c U S H h v P g V F w ( ) & L I z . , 3 4 Log Modulus (Pa) REFERENCE: This example details the molecular activities in a “typical” polymer as the temperature is changed. It provides some additional detail about the different transitions.
 & L. I. z. . , Log Modulus (Pa) REFERENCE: This example details the molecular activities in a typical polymer as the temperature is changed. It provides some additional detail about the different transitions.")
19
DMA tanδ REFERENCE: As previously discussed, the TAN DELTA is defined as the LOSS MODULUS divided by the STORAGE MODULUS. This dimensionless parameter provides important tiformation about the DAMPING or ENERGY DISSIPATION factors of a material. A number of TRANSITIONS can be seen in the TAN DELTA curve over the temperature range, depending on the type of sample being analyzed. These are ranked as follows (from lower temperature to higher temperature): GAMMA TRANSITION: Caused by bending and stretching of bonds in the molecule when it is stressed. BETA TRANSITION: Caused by rotation of molecular side groups when the molecule is stressed. ALPHA TRANSITION: Caused by main chain motion when the molecule is stressed (GLASS TRANSITION) MELT: Characterized by main chain slippage and loss of solid structure
: GAMMA TRANSITION: Caused by bending and stretching of bonds in the molecule when it is stressed. BETA TRANSITION: Caused by rotation of molecular side groups when the molecule is stressed. ALPHA TRANSITION: Caused by main chain motion when the molecule is stressed (GLASS TRANSITION) MELT: Characterized by main chain slippage and loss of solid structure.")
20
In more detail... Log Modulus (Pa) G l a s y R u b e r C o - i n k d f
5 6 7 8 9 1 G l a s y R u b e r C o - i n k d T m p t A B D E f M c U S H h v P g V F w ( ) & L I z . , 3 4 Log Modulus (Pa) Crystal-crystal slip Crystalline Polymer 99
 & L. I. z. . , Log Modulus (Pa) Crystal-crystal slip. Crystalline Polymer. 99.")
21
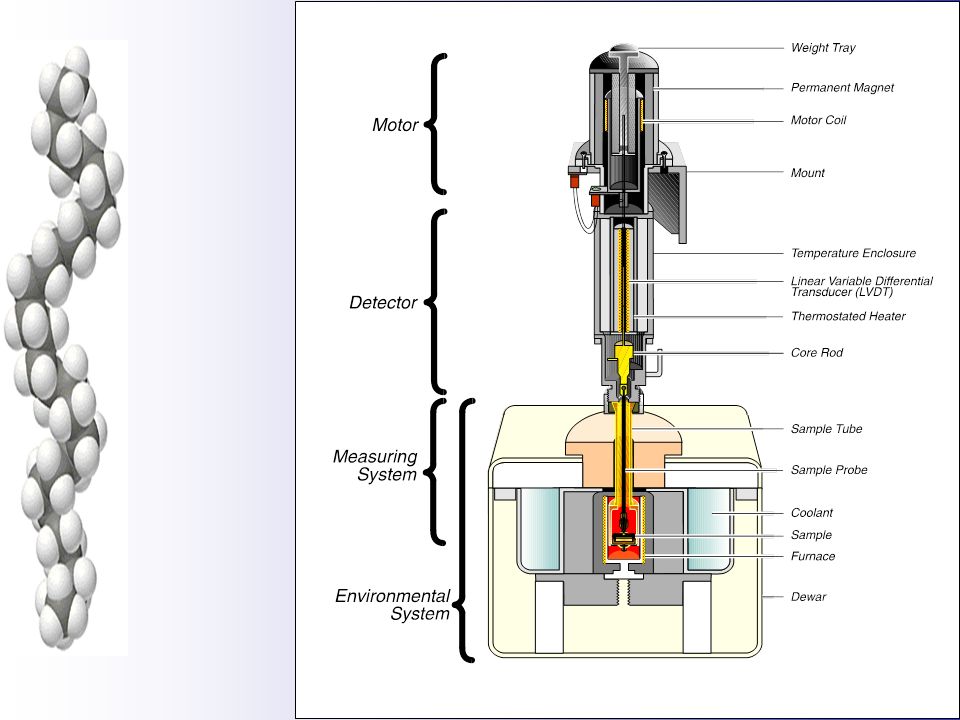
DMA Silnik odkształca próbkę Pomiar odkształcenia system mocowania
Piec/chłodzenie Force Motor Temperature Enclosure LVDT Core Rod Interchangeable Furnace Heat Sink/Cooling System Measuring System Coil Magnet

23
Sample Tube Probe Holder Sample Knurled Nut Furnace Base Bending Platform Probe Tip Heat Sink Threaded Collar Probe Holder Split Ferrule Sample Tube Sample Knurled Nut Bending Platform Probe Tip

24
DMA - możliwe badania Zmiana temperatury Izotermiczne
skanowanie częstotliwości Skanowanie naprężeń stałe naprężenie (pełzanie) Relaksacja naprężeń
 Relaksacja naprężeń.")
25
DMA - możliwe badania Topnienie, Tg, przejścia α, β, γ rekrystalizacja
utwardzanie właściwości mechaniczne (moduł) tłumienie skurcz HDT badania w cieczach (wpływ temperatury, jonów, pH) i atmosferze o zadanej wilgotności Badaniach w gazach Badania proszków
 tłumienie. skurcz. HDT. badania w cieczach (wpływ temperatury, jonów, pH) i atmosferze o zadanej wilgotności. Badaniach w gazach. Badania proszków.")
26
DMA możliwości obciążania
Zginanie 3 pkt zginanie 4 pkt Dual Cantilever Single Cantilever rozciąganie folii rozciąganie włókien ściskanie ścinanie

27
DMA 3-Point Bending For high modulus solid materials (105 to 1012 Pa)
Handles samples from 5 to 20mm

28
Tools

29
DMA Bending

30
DMA Cantilever Single and dual cantilever
Used for materials which soften and require support Modulus range: Dual Cantilever 104 to 109 Pa Single Cantilever 104 to 106 Pa REFERENCES: Dual cantileversystems are available in stainless steel. Two different types of dual cantilever clamp systems are available. They include: High Modulus Clamps Low Modulus These measuring systems are designed for analyzing solid materialswhich soften significantly during the experiment and which do not support their own weight.

31
DMA Cantilever REFERENCES:
Dual cantileversystems are available in stainless steel. Two different types of dual cantilever clamp systems are available. They include: High Modulus Clamps Low Modulus These measuring systems are designed for analyzing solid materialswhich soften significantly during the experiment and which do not support their own weight.

32
DMA Parallel Plate For semisolids or solids in modulus range (103 to 106 Pa)
")
33
DMA Parallel Plate

34
DMA Parallel Plate

35
DMA Extension For film, fiber, hair, etc in modulus range:
Film 103 to 1010 Pa Fiber 103 to 1012 Pa REFERENCE: Extension/tension measuring systems are available in both stainless steel and quartz, depending on the application. A range of clamp types are available to meet the needs of most laboratories. Special stainless steel clamps are available for films, there are clamps specifically designed for thin fibers, and traditional copper clips are available as well. Special sample preparation tool and sample mounting tools are included so that clamping of thin samples is simplified. These measuring systems are designed for analyzing films and fibers. Due to the excellent low force control of the DMA 7e motor, it is possible to routinely handle very thin films and fibers in this instrument. As with all of the DMA 7e measuring systems, the tips and base are easy to remove, clean and replace. This is an important feature for improving productivity. Since the design of the DMA 7e measuring systems are modular, a user has the freedom and flexibility to create his own measuring systems using the basic components provided by PE. For example, platform bases can be created, as well as probe tips.

36
DMA Extension REFERENCE:
Extension/tension measuring systems are available in both stainless steel and quartz, depending on the application. A range of clamp types are available to meet the needs of most laboratories. Special stainless steel clamps are available for films, there are clamps specifically designed for thin fibers, and traditional copper clips are available as well. Special sample preparation tool and sample mounting tools are included so that clamping of thin samples is simplified. These measuring systems are designed for analyzing films and fibers. Due to the excellent low force control of the DMA 7e motor, it is possible to routinely handle very thin films and fibers in this instrument. As with all of the DMA 7e measuring systems, the tips and base are easy to remove, clean and replace. This is an important feature for improving productivity. Since the design of the DMA 7e measuring systems are modular, a user has the freedom and flexibility to create his own measuring systems using the basic components provided by PE. For example, platform bases can be created, as well as probe tips.

37
DMA Extension REFERENCE:
Extension/tension measuring systems are available in both stainless steel and quartz, depending on the application. A range of clamp types are available to meet the needs of most laboratories. Special stainless steel clamps are available for films, there are clamps specifically designed for thin fibers, and traditional copper clips are available as well. Special sample preparation tool and sample mounting tools are included so that clamping of thin samples is simplified. These measuring systems are designed for analyzing films and fibers. Due to the excellent low force control of the DMA 7e motor, it is possible to routinely handle very thin films and fibers in this instrument. As with all of the DMA 7e measuring systems, the tips and base are easy to remove, clean and replace. This is an important feature for improving productivity. Since the design of the DMA 7e measuring systems are modular, a user has the freedom and flexibility to create his own measuring systems using the basic components provided by PE. For example, platform bases can be created, as well as probe tips.

38
DMA Shear REFERENCE: Extension/tension measuring systems are available in both stainless steel and quartz, depending on the application. A range of clamp types are available to meet the needs of most laboratories. Special stainless steel clamps are available for films, there are clamps specifically designed for thin fibers, and traditional copper clips are available as well. Special sample preparation tool and sample mounting tools are included so that clamping of thin samples is simplified. These measuring systems are designed for analyzing films and fibers. Due to the excellent low force control of the DMA 7e motor, it is possible to routinely handle very thin films and fibers in this instrument. As with all of the DMA 7e measuring systems, the tips and base are easy to remove, clean and replace. This is an important feature for improving productivity. Since the design of the DMA 7e measuring systems are modular, a user has the freedom and flexibility to create his own measuring systems using the basic components provided by PE. For example, platform bases can be created, as well as probe tips.

39
DMA Measuring System Range
REFERENCE: This slide summarizes the broad range of modulus over which the DMA 7e may be used. It clearly indicates the value of the multiple measuring systems which are available for the DMA 7e. This chart also serves as a useful tool in selecting the correct measuring system for a particular application and sample type. It should be noted that there is no one single measuring system which provides accurate measurements over the complete modulus range. Often, two or more experiments must be performed using different measuring systems to obtain modulus information over a very broad range.

40
DMA typowa krzywa

41
DMA

42
DMA Good Impact Strength b Transitions Tg Poor
Impact was good if Tg/Tb was 3 or less. 104

43
DMA (zakres użytkowania)
Beta Tg Operating range 105

44
DMA - utwardzanie h* vitrification point Modulus E” E’ T
50.0 70.0 90.0 110.0 130.0 150.0 10 1 2 3 4 5 6 7 8 E’ E” Modulus T h* E’-E” Crossover ~ gelation point vitrification point Minimum Viscosity (time, length, temperature ) 106 Pa ~ Solidity Melting Curing 106
 106 Pa ~ Solidity. Melting. Curing")
45
Izotermiczne utwardzanie Epoksydu DMA
Gel Time Storage Modulus 107 Loss Modulus 107 Complex Viscosity 106 106 Modulus (Pa) Parallel Plate Viscosity (Pa - s) tan 105 105 REFERENCE: PETAN # 44 The curing of epoxy or other thermoset materials is a chemical reaction process which involves the formation of high strength bonds, often termed crosslinking. Characterization of the curing process from the uncured liquid resin through the partially cured or completely cured final product is important when developing new products and for determination of molding process and end use requirements. The DMA 7e is one of the few instruments available which can monitor this complete cycle. In this example, a liquid epoxy resin/hardener system was analyzed at the “working” temperature of the material (25°C). The new Cup and Plate Measuring system was utilized for this analysis, since the starting material is a viscous liquid. Motor controls used for the experiment were Static Position Control (to maintain the upper plate in the same position during the experiment) and Dynamic Amplitude Control (set to 10 microns), which maintains the sample amplitude response constant during the experiment. The experiment was started and the results of the cure were monitored. At the completion of the experiment, the following curvetypes were generated as shown in this example: Storage modulus, loss modulus, TAN DELTA, and Complex Viscosity. During the first minute of the experiment, the sample is equilibrating and flowing evenly into the measuring system cup. At about 1.5 minutes, a minimum in the TAN DELTA curve is noted, which corresponds to the MINIMUM VISCOSITY of the sample. It is at this point that the curing reaction begins to accelerate, as noted by the increasing slope on the TAN DELTA curve. At 4 minutes, the slope of the TAN DELTA curve changes, indicating an increase in the reaction rate. Shortly after this, the slope of the storage, loss modulus, and complex viscosity also change, indicating the effects of the curing reaction. The onset of the change in the complex viscosity, or the peak of the TAN DELTA, are defined as the GEL POINT. Also, the slope of the storage modulus curve can be related to the reaction rate. At 8 minutes, the slopes of the modulus and viscosity curves again change, indicating the specimen is beginning to SET. The reaction rate slows as the concentration of reactant species diminishes. At 9 minutes, the TAN DELTA reaches a minimum, as the Tg exceeds the cure temperature. This is defined as the VITRIFICATION TIME. Shortly after this, the reaction rate slows dramatically as cure continues primarily through difusion. 104 104 Minimum Viscosity Vitrification Time 0.0 4.0 8.0 12.0 16.0 20.0 Ttime (min)
 Parallel Plate. Viscosity (Pa - s) tan REFERENCE: PETAN # 44. The curing of epoxy or other thermoset materials is a chemical reaction process which involves the formation of high strength bonds, often termed crosslinking. Characterization of the curing process from the uncured liquid resin through the partially cured or completely cured final product is important when developing new products and for determination of molding process and end use requirements. The DMA 7e is one of the few instruments available which can monitor this complete cycle. In this example, a liquid epoxy resin/hardener system was analyzed at the working temperature of the material (25°C). The new Cup and Plate Measuring system was utilized for this analysis, since the starting material is a viscous liquid. Motor controls used for the experiment were Static Position Control (to maintain the upper plate in the same position during the experiment) and Dynamic Amplitude Control (set to 10 microns), which maintains the sample amplitude response constant during the experiment. The experiment was started and the results of the cure were monitored. At the completion of the experiment, the following curvetypes were generated as shown in this example: Storage modulus, loss modulus, TAN DELTA, and Complex Viscosity. During the first minute of the experiment, the sample is equilibrating and flowing evenly into the measuring system cup. At about 1.5 minutes, a minimum in the TAN DELTA curve is noted, which corresponds to the MINIMUM VISCOSITY of the sample. It is at this point that the curing reaction begins to accelerate, as noted by the increasing slope on the TAN DELTA curve. At 4 minutes, the slope of the TAN DELTA curve changes, indicating an increase in the reaction rate. Shortly after this, the slope of the storage, loss modulus, and complex viscosity also change, indicating the effects of the curing reaction. The onset of the change in the complex viscosity, or the peak of the TAN DELTA, are defined as the GEL POINT. Also, the slope of the storage modulus curve can be related to the reaction rate. At 8 minutes, the slopes of the modulus and viscosity curves again change, indicating the specimen is beginning to SET. The reaction rate slows as the concentration of reactant species diminishes. At 9 minutes, the TAN DELTA reaches a minimum, as the Tg exceeds the cure temperature. This is defined as the VITRIFICATION TIME. Shortly after this, the reaction rate slows dramatically as cure continues primarily through difusion Minimum Viscosity. Vitrification Time Ttime (min)")
46
DMA - dodatek kauczuku do Epoksydu
r a g e M o d u l u s 1 1 1 3 % R u b b e r A 3 % R u b b e r B R e s i n 9 - 1 1 1 tan E´ (Pa) REFERENCE: The DMA 7e can be used to evaluate the effects of different rubber modifiers on epoxy systems, as shown here. The modulus and TAN Delta plots collected after running these samples in the DMA 7e are shown here. The MODULUS is an excellent indicator of IMPACT BEHAVIOR of the sample at a selected temperature, with a lower modulus value indicating better impact behavior. At 25°C (the temperature range of interest for this sample) both rubber modifiers improve impact behavior versus the base resin (i.e.. the modulus is lower than the base resin). Modifier B appears to provide the best impact performance, since it provides the lowest modulus at the use temperature (room temperature). The TAN DELTA is an indicator of the ability of a material to dissipate stress energy (I.e.. impact) or creep flow over time. In this example, several peaks are observed in the TAN DELTA curves. The low temperature peaks at approximately -110C correspond to “unbound elastomer” present in the material. Notice the TAN DELTA peak in the epoxy with Rubber B added at approximately -75C and in the epoxy with Rubber A at approximately -25C. These correspond to the elastomer that is incorporated in the epoxy. In practice, the larger the peak, the greater the “effective” elastomer content. Notice also that the epoxy with Rubber A will flow (or creep) less than the epoxy with Rubber B at room temperature because the material with rubber B has a lower Tan Delta at room temperature. At approximately 50C, the glass transition of the epoxy can be easily observed due to the large change in the MODULUS and the peak in the TAN DELTA curve. 8 - 2 1 1 T a n g e n t D e l t a - 1 5 - 1 1 - 7 - 3 1 5 9 1 3 T e m p e r a t u r e ( C )
 REFERENCE: The DMA 7e can be used to evaluate the effects of different rubber modifiers on epoxy systems, as shown here. The modulus and TAN Delta plots collected after running these samples in the DMA 7e are shown here. The MODULUS is an excellent indicator of IMPACT BEHAVIOR of the sample at a selected temperature, with a lower modulus value indicating better impact behavior. At 25°C (the temperature range of interest for this sample) both rubber modifiers improve impact behavior versus the base resin (i.e.. the modulus is lower than the base resin). Modifier B appears to provide the best impact performance, since it provides the lowest modulus at the use temperature (room temperature). The TAN DELTA is an indicator of the ability of a material to dissipate stress energy (I.e.. impact) or creep flow over time. In this example, several peaks are observed in the TAN DELTA curves. The low temperature peaks at approximately -110C correspond to unbound elastomer present in the material. Notice the TAN DELTA peak in the epoxy with Rubber B added at approximately -75C and in the epoxy with Rubber A at approximately -25C. These correspond to the elastomer that is incorporated in the epoxy. In practice, the larger the peak, the greater the effective elastomer content. Notice also that the epoxy with Rubber A will flow (or creep) less than the epoxy with Rubber B at room temperature because the material with rubber B has a lower Tan Delta at room temperature. At approximately 50C, the glass transition of the epoxy can be easily observed due to the large change in the MODULUS and the peak in the TAN DELTA curve T. a. n. g. e. n. t. D. e. l. t. a T. e. m. p. e. r. a. t. u. r. e. ( C. )")
47
REFERENCE: PETAN #45 EPDM is an elastomer which is generally used in conjunction with other elastomers and modifiers. The flexibility, rigidity and softness characteristics can vary substantially depending on how the EPDM is compounded, and therefore it is important to characterize the final product to determine if its properties are consistent with the end use application. DMA has been found to be a fast, simple tool for the characterization of elastomers such as EPDM. In this experiment, an EPDM sample was analyzed in the DMA 7e equipped with the Quartz 3 point Bending measuring system. The sample was scanned from -170 C to 175 C at a scan rate of 1 C/minute using Force Control motor controls. The MODULUS and TAN DELTA results are shown here. The STORAGE MODULUS at low temperatures provides information about the impact performance (the lower the stortage modulus the better the impact performance). The decrease in modulus at -160 C (GAMMA TRANSITION) is referred to as the BRITTLE POINT. This point is correlated with brittleness, impact strength and rigidity. The plateau in the storage modulus between -150 C and -60 C is referred to as the GLASSY PLATEAU since the limited free volume in the sample prevents additional molecular motion. This area is sensitive to factors such as the degree of cure, impact modifiers and other additives. The onset of the glass transition can be seen at -40 , followed by a rapid decrease in modulus as temperature increases, finally reaching a plateau at 70 C. The TAN DELTA plot demonstrates the presence of a weak BETA transition between -160 C and -100 C. This transition is related to slippage of main chain entanglements and is commonly seen in elastomers. The Glass Transition is also clearly seen as a large peak in the TAN DELTA curve. Additional transitions are seen in the glass transition above 0 C. These are related to free propylene, oils, extenders and other additives in the compound. These may also be the result of processing effects.
. The decrease in modulus at -160 C (GAMMA TRANSITION) is referred to as the BRITTLE POINT. This point is correlated with brittleness, impact strength and rigidity. The plateau in the storage modulus between -150 C and -60 C is referred to as the GLASSY PLATEAU since the limited free volume in the sample prevents additional molecular motion. This area is sensitive to factors such as the degree of cure, impact modifiers and other additives. The onset of the glass transition can be seen at -40 , followed by a rapid decrease in modulus as temperature increases, finally reaching a plateau at 70 C. The TAN DELTA plot demonstrates the presence of a weak BETA transition between -160 C and -100 C. This transition is related to slippage of main chain entanglements and is commonly seen in elastomers. The Glass Transition is also clearly seen as a large peak in the TAN DELTA curve. Additional transitions are seen in the glass transition above 0 C. These are related to free propylene, oils, extenders and other additives in the compound. These may also be the result of processing effects.")
48
DMA PC tan (x 10-2) Modulus (Pa x 109) Temperature (°C) 1.0 1.4
Beta Transition 85°C Dual Cantilever Transition 1.0 1.4 1.8 2.2 2.6 3.0 3.4 1.0 1.4 1.8 2.2 2.6 3.0 3.4 Storage Modulus tan (x 10-2) Process Stress 70 °C Modulus (Pa x 109) Alpha Transition (Tg) 100 °C REFERENCE: PETAN #42 Polycarbonate is a widely used engineering thermoplastic, and the analysis of the mechanical properties of this material is very important. In this example, the DMA 7e was used to characterize a Polycarbonate sample from very low temperatures up through its glass transition at 160C. The sample was clamped in the DUAL CANTILEVER measuring system for the analysis. In addition, the STRAIN CONTROL motor feature was used at the start of the run to maintain constant strain during the experiment. The STORAGE MODULUS demonstrates three events over the temperature range the sample was analyzed, as does the TAN DELTA. From the start of the run to approximately 0°C we note a constant decrease in the storage modulus and a large peak in the TAN DELTA curve (with peak maxima at -85°C). This event corresponds to the “BETA TRANSITION” in the material. During this period, changes in the molecular packing of the main polymer chains occurs along with increasing free volume resulting in increasing carbonate group rotation. Increasing crystallinity in the Polycarbonate will affect this event, as evidenced by a decreased magnitude of the TAN Delta PEAK AND AN INCREASING PEAK TEMPERATURE. A second event is noted between 0 C and 125 C. Here, we see a decrease in the MODULUS and a peak in the TAN DELTA. This transition corresponds to PROCESSING STRESS such as freezing in of mechanical stresses and orientation effects during molding or blowing. Annealing is often used to eliminate these stresses. Finally, the glass transition of the PC is noted at 160 C (as noted by the rapid decrease in the MODULUS and the sharp rise in the TAN DELTA curve. The specimen becomes very soft and rubbery and, since all useable information has been obtained, the experiment was terminated. tan -200.0 -150.0 -100.0 -50.0 0.0 50.0 100.0 150.0 200.0 Temperature (°C)
 Process. Stress. 70 °C. Modulus (Pa x 109) Alpha. Transition. (Tg) 100 °C. REFERENCE: PETAN #42. Polycarbonate is a widely used engineering thermoplastic, and the analysis of the mechanical properties of this material is very important. In this example, the DMA 7e was used to characterize a Polycarbonate sample from very low temperatures up through its glass transition at 160C. The sample was clamped in the DUAL CANTILEVER measuring system for the analysis. In addition, the STRAIN CONTROL motor feature was used at the start of the run to maintain constant strain during the experiment. The STORAGE MODULUS demonstrates three events over the temperature range the sample was analyzed, as does the TAN DELTA. From the start of the run to approximately 0°C we note a constant decrease in the storage modulus and a large peak in the TAN DELTA curve (with peak maxima at -85°C). This event corresponds to the BETA TRANSITION in the material. During this period, changes in the molecular packing of the main polymer chains occurs along with increasing free volume resulting in increasing carbonate group rotation. Increasing crystallinity in the Polycarbonate will affect this event, as evidenced by a decreased magnitude of the TAN Delta PEAK AND AN INCREASING PEAK TEMPERATURE. A second event is noted between 0 C and 125 C. Here, we see a decrease in the MODULUS and a peak in the TAN DELTA. This transition corresponds to PROCESSING STRESS such as freezing in of mechanical stresses and orientation effects during molding or blowing. Annealing is often used to eliminate these stresses. Finally, the glass transition of the PC is noted at 160 C (as noted by the rapid decrease in the MODULUS and the sharp rise in the TAN DELTA curve. The specimen becomes very soft and rubbery and, since all useable information has been obtained, the experiment was terminated. tan Temperature (°C)")
49
Epoxy-Glass Composite
4.00 2.00 Storage Modulus 1.80 3.50 1.60 3.00 1.40 Three-Point Bending 2.50 1.20 2.00 (x 10-1) 1.00 Modulus (Pa x 1010 ) 1.50 d 0.80 tan REFERENCE: PETAN # 36 To analyze a composite in more detail, a temperature scan over a broad temperature range is often performed. Typically, information below the GLASS TRANSITION and above the glass transition are important to fully understanding the mechanical properties of the composite. After quickly identifying the glass transition temperature of an epoxy glass composite by DSC, a DMA 7e was used to characterize the mechanical properties of the composite. The mechanical properties must be known so that information concerning the degree of cure of the resin, dimensional stability of the composite, and modulus can be determined. The sample was analyzed in the stainless steel 3-point bending measuring system in the temperature scan mode over the temperature range 50 to 225°C at a heating rate of 2°C/minute. In this example, the storage modulus and TAN DELTA are shown over the temperature range. The storage modulus begins at a high level (1.8 x10e10 Pa) and decreases slowly until approximately 120°C, the glass transition temperature. The high storage modulus results from the fact that the epoxy is in the glassy state below the glass transition temperature. The modulus than decreases rapidly and reaches a plateau near 180°C. At this temperature, the epoxy resin has little contribution to the total modulus, which is primarily the result of the glass weave. The TAN DELTA curve demonstrates a characteristic large peak as the material passes through the glass transition temperature region. NOTE: the baseline shift in the TAN DELTA curve is because below the Tg TAN DELTA is dominated by the COMPOSITE behavior, and above Tg it is dominated by the GLASS behavior. 1.00 0.60 tan 0.40 0.50 0.20 0.00 0.0 50.0 100.0 150.0 200.0 250.0 300.0 Temperature ( C) o 279001
 Modulus (Pa x 1010 ) d tan REFERENCE: PETAN # 36. To analyze a composite in more detail, a temperature scan over a broad temperature range is often performed. Typically, information below the GLASS TRANSITION and above the glass transition are important to fully understanding the mechanical properties of the composite. After quickly identifying the glass transition temperature of an epoxy glass composite by DSC, a DMA 7e was used to characterize the mechanical properties of the composite. The mechanical properties must be known so that information concerning the degree of cure of the resin, dimensional stability of the composite, and modulus can be determined. The sample was analyzed in the stainless steel 3-point bending measuring system in the temperature scan mode over the temperature range 50 to 225°C at a heating rate of 2°C/minute. In this example, the storage modulus and TAN DELTA are shown over the temperature range. The storage modulus begins at a high level (1.8 x10e10 Pa) and decreases slowly until approximately 120°C, the glass transition temperature. The high storage modulus results from the fact that the epoxy is in the glassy state below the glass transition temperature. The modulus than decreases rapidly and reaches a plateau near 180°C. At this temperature, the epoxy resin has little contribution to the total modulus, which is primarily the result of the glass weave. The TAN DELTA curve demonstrates a characteristic large peak as the material passes through the glass transition temperature region. NOTE: the baseline shift in the TAN DELTA curve is because below the Tg TAN DELTA is dominated by the COMPOSITE behavior, and above Tg it is dominated by the GLASS behavior tan Temperature. ( C) o")
50
DMA włókna PP Storage Modulus 1.9 1011 1.7 Loss Modulus 1.5 1010 1.3
-5 oC Beta (Tg) Alpha 1.9 110 oC 1011 100 oC Beta 5 oC 1.7 Loss Modulus Melt 140 oC Fiber 1.5 tan (x 10 ) -1 Extension 1010 50 oC Modulus (Pa) 1.3 Beta' -25 oC 1.1 REFERENCE: PETAN #40 Polypropylene is a widely used engineering thermoplastic whose properties can be tailored for many end uses. When used in a fiber form, the modulus and effects of past processing history are important. The DMA 7e can be used to routinely analyze even thin low modulus fibers because of the excellen “low-end” control of the force motor. In the example shown, a thin (39 micron) single fiber used in fabric manufacturing was analyzed over a temperature range of -170°C to 150°C using a scan rate of 5°C/minute. The stainless steel fiber extensional analysis measuring system was used. No special motor controls were utilized, and the sample was run in the Force Control mode. The plot shows the storage modulus, loss modulus, and TAN DELTA curves obtained from the analysis. The broad peak in the TAN DELTA curve from -150°C, with a maxima at 75°C, is the GAMMA TRANSITION. This event is not affected by changes in the crystallinity of the sample. The storage modulus demonstrates a plateau from -150°C to -75°C, referred to as the GLASSY PLATEAU. The modulus level in this area is directly related to the degree of crystallinity in the sample (the higher the crystallinity, the higher the storage modulus in this area). The TAN DELTA curve indicates several events in the range from -50°C to 25°C. The first is a BETA PRIME transition at -25°C, which is often related to relaxations in the amorphous portions of the material. Note that this transition is accompanied by a small decrease in the storage modulus. This is followed by a large BETA TRANSITION with a peak in the TAN DELTA at 5°C. This peak, again accompanied by a decrease in the storage modulus, is related to motions in the amorphous regions. Since the amorphous component is very sensitive to thermal history, this peak represents these changes. Additional peaks in the TAN DELTA curve are related to processing effects and the crystalline structure of the polymer. Finally, melting is observed at 140°C. It is important to note that this entire experiment, from the start where the epoxy is in the liquid resin state to when it is a fully cured state solid, was performed in a SINGLE RUN with a SINGLE MEASURING SYSTEM. 109 Gamma 0.9 -75 oC tan -200.0 -150.0 -100.0 -50.0 0.0 50.0 100.0 150.0 200.0 Temperature (oC) 334002
 Alpha. oC oC. Beta. 5 oC Loss Modulus. Melt. 140 oC. Fiber tan. (x 10 ) -1. Extension oC. Modulus (Pa) 1.3. Beta -25 oC REFERENCE: PETAN #40. Polypropylene is a widely used engineering thermoplastic whose properties can be tailored for many end uses. When used in a fiber form, the modulus and effects of past processing history are important. The DMA 7e can be used to routinely analyze even thin low modulus fibers because of the excellen low-end control of the force motor. In the example shown, a thin (39 micron) single fiber used in fabric manufacturing was analyzed over a temperature range of -170°C to 150°C using a scan rate of 5°C/minute. The stainless steel fiber extensional analysis measuring system was used. No special motor controls were utilized, and the sample was run in the Force Control mode. The plot shows the storage modulus, loss modulus, and TAN DELTA curves obtained from the analysis. The broad peak in the TAN DELTA curve from -150°C, with a maxima at 75°C, is the GAMMA TRANSITION. This event is not affected by changes in the crystallinity of the sample. The storage modulus demonstrates a plateau from -150°C to -75°C, referred to as the GLASSY PLATEAU. The modulus level in this area is directly related to the degree of crystallinity in the sample (the higher the crystallinity, the higher the storage modulus in this area). The TAN DELTA curve indicates several events in the range from -50°C to 25°C. The first is a BETA PRIME transition at -25°C, which is often related to relaxations in the amorphous portions of the material. Note that this transition is accompanied by a small decrease in the storage modulus. This is followed by a large BETA TRANSITION with a peak in the TAN DELTA at 5°C. This peak, again accompanied by a decrease in the storage modulus, is related to motions in the amorphous regions. Since the amorphous component is very sensitive to thermal history, this peak represents these changes. Additional peaks in the TAN DELTA curve are related to processing effects and the crystalline structure of the polymer. Finally, melting is observed at 140°C. It is important to note that this entire experiment, from the start where the epoxy is in the liquid resin state to when it is a fully cured state solid, was performed in a SINGLE RUN with a SINGLE MEASURING SYSTEM Gamma oC. tan Temperature. (oC)")
51
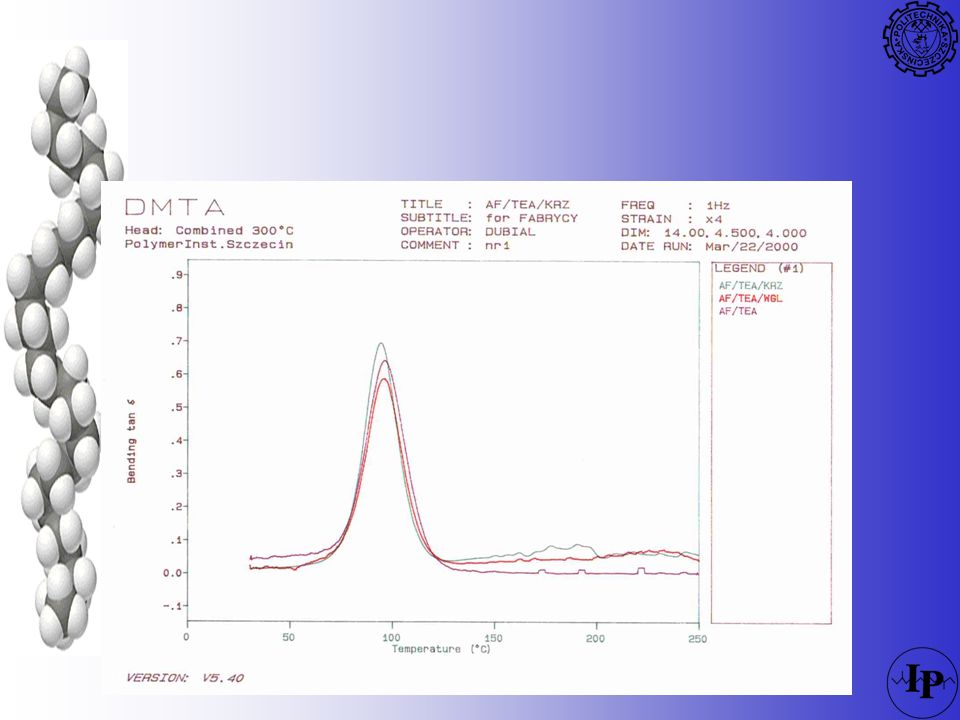
DMTA - epoksyd

52
DMTA - epoksyd

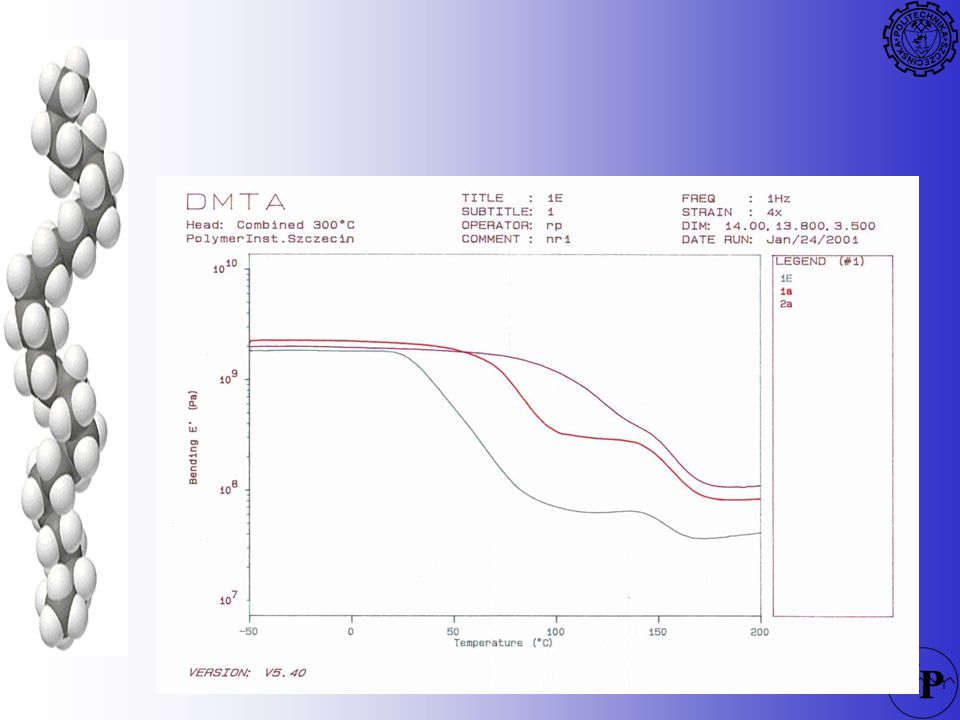
53
DMTA

56
To Review, DMA ties together...
molecular structure product properties Molecular weight MW Distribution Chain Branching Cross linking Entanglements Phases Crystallinity Free Volume Localized motion Relaxation Mechanisms Dimensional Stability Impact properties Long term behavior Environmental resistance Temperature performance Adhesion Tack Peel Material Behavior processing conditions Stress Strain Temperature Heat History Frequency Pressure Heat set 134

58
TMA

59
TMA Thermomechanical Analyzer
Pomiar zmian wymiarów, sztywności, objętości w zależności od temperatury HDT, mięknięcie, rozszerzalnośc cieplna Flexure Probe position Tg Expansion T

60
TMA Materiał jest ogrzewany pod małym obciążeniem
Materiał zmienia się z temperaturą zmiany można opisać jako zmiany objętości swobodnej lub temperaturę penetracji Free Volume 76

61
TMA z Y metale, polimery, ceramika, szkło rozszerzają się
epoksydy, farby, lakiery zmniejszają objętość Np. Przy zastosowaniu różnych materiałów w jednej części (rozszerzalności) połączenia metal - polimer z Y X
 połączenia metal - polimer. z. Y. X.")
62
TMA Coeffient of Thermal Expansion (CTE) Tg Free Volume Occupied Temperature/K Volume/mm3 CTE Zmiana współczynnika rozszerzalności (nachylenie) oznacza przejście fazowe (Tg)
 oznacza przejście fazowe (Tg)")
63
Objętość swobodna Część objętości materiału nie zajęta przez łańcuchy
poniżej Tg jest zbyt mała, żeby całe łańcuchy mogły się ruszać

64
Principle of TMA

65
TMA Force Motor Coil Magnet Temperature Enclosure LVDT Core Rod
Interchangeable Furnace Heat Sink/Cooling System Measuring System Coil Magnet 75

66
TMA Expansion soft material Penetration hard material
Sample holder Probe Chuck Sample Expansion soft material Penetration hard material Penetration harder material Tension Film, Fiber Bending Bulk TMAで用いられるプローブには、試料への荷重のかけ方に対応していくつかの種類がある。 (a)膨張・圧縮プローブ:圧縮荷重をかけ、試料の熱膨張や、転移による形状変化を計測するためのプローブである。もっとも良く用いられる。 (b)針入プローブ、円錐プローブ:圧縮プローブの先端が細い針状になっており、局部的に大きな荷重をかけることにより、試料の軟化点を測定するためのプローブである。 (c)引っ張りプローブ:フィルム状、ファイバー状の試料に用いられ、引っ張り荷重をかけ、試料の熱膨張や、熱収縮等を測定するためのプローブである。 (d)曲げプローブ:試料に曲げ荷重をかけ、試料の変形温度を測定するためのプローブである。 プローブの材質としては、石英ガラス、アルミナ、金属等が用いられ、温度範囲や用途によって使い分けられる。
膨張・圧縮プローブ:圧縮荷重をかけ、試料の熱膨張や、転移による形状変化を計測するためのプローブである。もっとも良く用いられる。 (b)針入プローブ、円錐プローブ:圧縮プローブの先端が細い針状になっており、局部的に大きな荷重をかけることにより、試料の軟化点を測定するためのプローブである。 (c)引っ張りプローブ:フィルム状、ファイバー状の試料に用いられ、引っ張り荷重をかけ、試料の熱膨張や、熱収縮等を測定するためのプローブである。 (d)曲げプローブ:試料に曲げ荷重をかけ、試料の変形温度を測定するためのプローブである。 プローブの材質としては、石英ガラス、アルミナ、金属等が用いられ、温度範囲や用途によって使い分けられる。")
67
Tension mode Expansion mode Penetration mode

68
TMA penetracja 77

69
TMA Tg Free Volume Occupied 78

70
Glass transition of Polyvinyl chloride
TMA Zastosowania Glass transition of Polyvinyl chloride Deformation mode : Compression/Expansion ( DOP : dioctyl phthalate )
")
71
Softening Temp. of Polymers Deformation mode : Penetration
TMA Zastosowania Softening Temp. of Polymers Deformation mode : Penetration Nylon

72
Extension / Shrinkage of Polyethylene film
TMA Zastosowania Extension / Shrinkage of Polyethylene film Deformation mode : Tension ( A : Drawing direction B : Transverse direction )
")
Podobne prezentacje


 Warsaw University of Life.>")