Pobierz prezentację
Pobieranie prezentacji. Proszę czekać

1
Dynamika struktury domenowej w relaksorowych kryształach ferroelektrycznych
1. Niobian strontowo-barowy Sr0.61Ba0.39Nb2O6 (SBN) Tc=353K 4/mmm→4mm relaksor 0.25 < x < 0.75 2. Siarczan trójglicyny (NH2CH2COOH)3H2SO4 (TGS) Tc=322K P21/m→P21 kryształ jednorodny 3. Kompleks kwasu tellurowego z fosforanami amonu Te(OH)6·2NH4H2PO4·(NH4)2HPO4 (TAAP) Tc=321K P2/m→Pm kryształ niejednorodny Katarzyna Matyjasek
 Tc=353K 4/mmm→4mm relaksor < x < Siarczan trójglicyny (NH2CH2COOH)3H2SO4 (TGS) Tc=322K P21/m→P21 kryształ jednorodny. 3. Kompleks kwasu tellurowego z fosforanami amonu. Te(OH)6·2NH4H2PO4·(NH4)2HPO4 (TAAP) Tc=321K P2/m→Pm kryształ niejednorodny. Katarzyna Matyjasek.")
2
Curie–Weiss law Teoria Landaua – Ginzburga – Devonshire’a.
Gęstość energii swobodnej G można przybliżyć, używając następującego szeregu potęgowego polaryzacji P. Curie–Weiss law

3
1 – defects – free material 2 – a weak random field
Double well potential and ferroelectric unit cell Random field (asymmetric) disorder in a ferroelectric material 1 – defects – free material 2 – a weak random field 3 – non-polar phase
 disorder in a ferroelectric material. 1 – defects – free material. 2 – a weak random field. 3 – non-polar phase.")
5
non-uniform (TAAP) and relaxor (SBN) ferroelectric crystals
Examples of the hysteresis loops measured with a bridge method for a uniform (TGS), non-uniform (TAAP) and relaxor (SBN) ferroelectric crystals P E Tryglicine sulphate (TGS), E=14kV/m, EC=7.5kV/m, P=2.13µC/cm2 P P E Telluric acid ammonium phosphate (TAAP), E=480kV/m, EC=187kV/m, P=1.16µC/cm2, Eb=225kV/m E Strontium barium niobate (SBN), E=680kV/m, EC=360kV/m, P=17.5µC/cm2
, non-uniform (TAAP) and relaxor (SBN) ferroelectric crystals. P. E. Tryglicine sulphate (TGS), E=14kV/m, EC=7.5kV/m, P=2.13µC/cm2. P. P. E. Telluric acid ammonium phosphate (TAAP), E=480kV/m, EC=187kV/m, P=1.16µC/cm2, Eb=225kV/m. E. Strontium barium niobate (SBN), E=680kV/m, EC=360kV/m, P=17.5µC/cm2.")
6
TAAP E=2.2kV/cm E=0

7
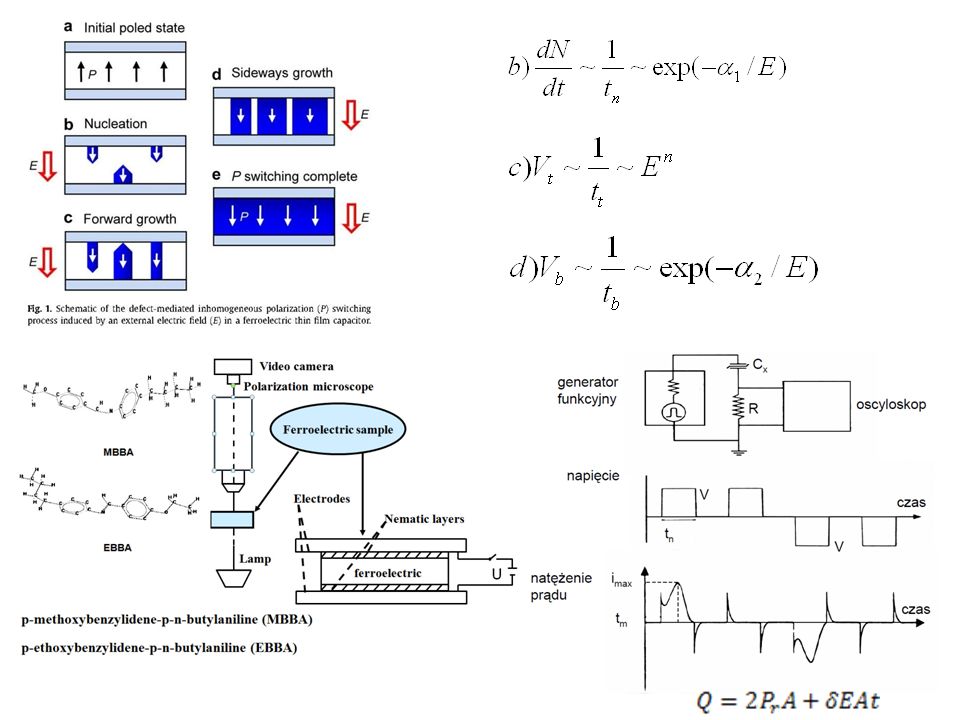
The domain pattern evolution observed in TGS crystal sample during switching process in negative
electric field of 0.4 kVcm−1 (applied at t = 0). Time fromthemoment of applying E in [s] (a) 0.2; (b) 0.4; (c) 0.8; (d) 1.8; Distribution of domains in: negative E in [kVcm−1] (e) 0.5; (f ) 0.7; positive E (g) 0.4; (h) 0.7. Domain patten evolution observed in SBN crystal sample during switching in the positive electric field of 2.8 kVcm−1. (a) — initial single domain state. Time from the moment of applying E in [s]; (b) — 0.2; (c) — 0.4; (d) — 0.6; (e) — 0.8; (f ) — 1; (g) — 3.8; (h) — shows the domain pattern obtained after applying the negative electric field of 2.8 kVcm−1. Ferroelectrics 2013; K. Matyjasek, M. Orłowski
. Time fromthemoment of applying E in [s] (a) 0.2; (b) 0.4; (c) 0.8; (d) 1.8; Distribution of domains in: negative E in [kVcm−1] (e) 0.5; (f ) 0.7; positive E (g) 0.4; (h) 0.7. Domain patten evolution observed in SBN crystal sample during switching in the positive electric. field of 2.8 kVcm−1. (a) — initial single domain state. Time from the moment of applying E in [s]; (b) — 0.2; (c) — 0.4; (d) — 0.6; (e) — 0.8; (f ) — 1; (g) — 3.8; (h) — shows the domain pattern obtained after. applying the negative electric field of 2.8 kVcm−1. Ferroelectrics 2013; K. Matyjasek, M. Orłowski.")
8
61 TGS TAAP

10
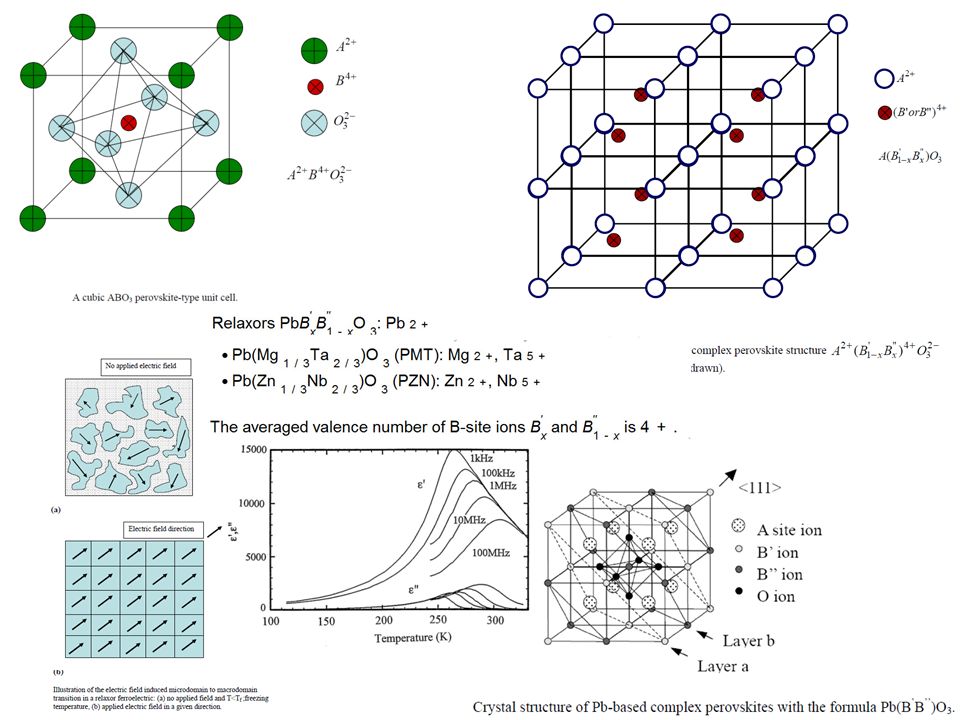
A (110) plane through the PSN simulation box representing the projected
local field (arbitrary regions (approximately circular) have small approximately homogeneous units) at each Pb site in the plane. Chemically ordered fields, and chemically disordered regions have larger more varied and disordered local fields. After [Tinte, Burton, Cockayne and Waghmare: Phys. Rev. Lett. 97, (2006)].
 have small approximately. homogeneous units) at each Pb site in the plane. Chemically. ordered fields, and chemically disordered regions have larger. more varied and disordered local fields. After [Tinte, Burton, Cockayne. and Waghmare: Phys. Rev. Lett. 97, (2006)].")
11
Molecular Dynamics Simulations of relaxors
Takeshi Nishimatsu 2010

12
Niobian strontowo-barowy Sr0. 61Ba0
Niobian strontowo-barowy Sr0.61Ba0.39Nb2O6 (SBN) Tc=353K 4/mmm→4mm relaxor 0.25 < x < 0.75 295K 354K SrxBa1-xNb2O6 (x=0.5) - disordered Ba – Sr site - site preferred by Sr alternative oxygen atom site in niobium oxygen octahedra
 Tc=353K 4/mmm→4mm relaxor 0.25 < x < K. 354K. SrxBa1-xNb2O6 (x=0.5) - disordered Ba – Sr site. - site preferred by Sr. alternative oxygen atom site. in niobium oxygen octahedra.")
13
SBN 70 SBN 26 SBN 33 SBN26 +0.6 -0.6kV/cm 1<E<1.5kV/cm SBN70 SBN26 1.3 1.4 1.5kV/cm 1kV/cm, t=8s

14
SBN 61 + Cr 320K 330K 340K E=2.4kV/cm E=-2.4kV/cm E=2.4kV/cm
K Matyjasek, S M Kaczmarek, L I Ivleva Ferroelectrics 2012

15
2,8 kV/cm 2,5 kV/cm Ni (0,01 wt.%) 1,1 kV/cm Ni(0,5 wt.%)
 1,1 kV/cm Ni(0,5 wt.%)")
Podobne prezentacje


 Warsaw University of Life.>")


 0 b)Traker i.FGD ii.TPC c)SMRD i.W.>")