Pobierz prezentację
Pobieranie prezentacji. Proszę czekać

1
The statistical properties and possible causes of polar motion prediction errors Wiesław Kosek (1), Maciej Kalarus (2), Agnieszka Wnęk (1), Maria Zbylut (1) (1) Environmental Engineering and Land Surveying, University of Agriculture in Krakow, Poland (2) Space Research Centre, Polish Academy of Sciences, Warsaw, Poland XXIX General Assembly, Honolulu, Hawaii - August 3 - 14, 2015
, Maciej Kalarus (2), Agnieszka Wnęk (1), Maria Zbylut (1) (1) Environmental Engineering and Land Surveying, University of Agriculture in Krakow, Poland (2) Space Research Centre, Polish Academy of Sciences, Warsaw, Poland XXIX General Assembly, Honolulu, Hawaii - August , 2015")
2
Future EOP data are needed to compute real-time transformation between the celestial and terrestrial reference frames. This transformation is important for the NASA Deep Space Network, which is an international network of antennas that supports: - interplanetary spacecraft missions, - interplanetary spacecraft missions, - radio and radar astronomy observations, - radio and radar astronomy observations, - selected Earth-orbiting missions. - selected Earth-orbiting missions.

3
EOP Prediction – international cooperation Earth Orientation Parameters Prediction Comparison Campaign (EOPPCC) (Oct. 2005 – Mar. 2008) [H. Schuh (Chair), W. Kosek, M. Kalarus] The goal: comparison of the EOP prediction results from different methods. 10 participants, Weekly predictions. IERS Working Group on Predictions (WGP) ( Apr. 2006 – Oct. 2009) [W. Wooden (Chair), T. Van Dam (input data), W. Kosek (algorithms)] The goal: to show advantages and disadvantages of different prediction algorithms and quality of different data IERS Workshop on EOP Combination and Prediction ( Warsaw, 19-21 October 2009) [W. Kosek, B. Wooden (Chairs)] Recommendations: set goals for EOP prediction accuracy create a short (two week) prediction series and a longer (one year) prediction series investigate the feasibility of initiating operational ensemble EOP predictions investigate ensemble geophysical analyses and forecasts with the goal of creating operational ensemble geophysical analysis and forecasts Earth Orientation Parameters Combination of Prediction Pilot Project (EOPCPPP) (Oct. 2010 – now ) [Chair: B. Luzum, co-chair: W. Kosek], The goal: To determine the feasibility and benefits of combining EOP predictions on a daily basis and to determine the best algorithms for EOP predictions combinations. 10 participants.
 [H. Schuh (Chair), W. Kosek, M. Kalarus] The goal: comparison of the EOP prediction results from different methods. 10 participants, Weekly predictions. IERS Working Group on Predictions (WGP) ( Apr – Oct. 2009) [W. Wooden (Chair), T. Van Dam (input data), W. Kosek (algorithms)] The goal: to show advantages and disadvantages of different prediction algorithms and quality of different data IERS Workshop on EOP Combination and Prediction ( Warsaw, October 2009) [W. Kosek, B. Wooden (Chairs)] Recommendations: set goals for EOP prediction accuracy create a short (two week) prediction series and a longer (one year) prediction series investigate the feasibility of initiating operational ensemble EOP predictions investigate ensemble geophysical analyses and forecasts with the goal of creating operational ensemble geophysical analysis and forecasts Earth Orientation Parameters Combination of Prediction Pilot Project (EOPCPPP) (Oct – now ) [Chair: B. Luzum, co-chair: W. Kosek], The goal: To determine the feasibility and benefits of combining EOP predictions on a daily basis and to determine the best algorithms for EOP predictions combinations. 10 participants..")
4
DATA x, y from the IERS: EOPC04_IAU2000.62-now (1962.0 - 2015.6), Δt = 1 day, http://hpiers.obspm.fr/iers/eop/eopc04_05/,http://hpiers.obspm.fr/iers/eop/eopc04_05/ Long term earth orientation data EOP C01 IAU2000 (1846-now) http://www.iers.org/IERS/EN/DataProducts/EarthOrientationData/eop.html http://www.iers.org/IERS/EN/DataProducts/EarthOrientationData/eop.html x,y pole coordinates data prediction results from different participants of the EOPCPPP, Δt = 1 day, http://www.cbk.waw.pl/eopcppp/ http://www.cbk.waw.pl/eopcppp/ http://maia.usno.navy.mil/eopcppp/eopcppp.html Equatorial and axial components of atmospheric angular momentum from NCEP/NCAR, aam.ncep.reanalysis.* (1948 - 2009.3) Δt = 0.25 day, ftp://ftp.aer.com/pub/anon_collaborations/sba/, Equatorial components of ocean angular momentum: c20010701.oam (Jan. 1980 - Mar. 2002) Δt = 1 day, ECCO_kf066b.oam (Jan. 1993 - Dec. 2008), Δt = 1 day, http://euler.jpl.nasa.gov/sbo/sbo_data.html, http://euler.jpl.nasa.gov/sbo/sbo_data.html
 Δt = 1 day, ECCO_kf066b.oam (Jan Dec. 2008), Δt = 1 day,")
6
EOPPCC (2005-2008) RESULTS Mean prediction errors (in mas) of x, y pole coordinates data computed from prediction results of different participants in the EOPPCC.
 RESULTS Mean prediction errors (in mas) of x, y pole coordinates data computed from prediction results of different participants in the EOPPCC.")
7
The participants of the EOPCPPP and their contribution to x,y predictions. AuthorInstitute Total number of computed predictions of x, y Brian Luzum (BL)U.S. Naval Observatory, Washington DC, USA 1630 1083 comb Daniel Gambis (DG)Paris Observatory, Paris, France1740 Leonid Zotov (LZ) Sternberg Astronomical Institute of Moscow State University, Department of Gravimetry, Moscow, Russia 1360 Maciej Kalarus (MK)Space Research Centre, PAS, Warsaw, Poland1591 Richard Gross (RG)Jet Propulsion Laboratory, Pasadena, California, USA1663 Viktor Tissen (VT) Siberian Scientific Research Institute of Metrology and Siberian State Geodetic Academy, Russia 1667 Wiesław Kosek (WK)Space Research Centre, PAS, Warsaw, Poland1782 Xu Xueqing (XX)Shanghai Astronomical Observatory, China1532 Zinovy Malkin (ZM) Pulkovo Observatory, Russia 1777
U.S. Naval Observatory, Washington DC, USA comb Daniel Gambis (DG)Paris Observatory, Paris, France1740 Leonid Zotov (LZ) Sternberg Astronomical Institute of Moscow State University, Department of Gravimetry, Moscow, Russia 1360 Maciej Kalarus (MK)Space Research Centre, PAS, Warsaw, Poland1591 Richard Gross (RG)Jet Propulsion Laboratory, Pasadena, California, USA1663 Viktor Tissen (VT) Siberian Scientific Research Institute of Metrology and Siberian State Geodetic Academy, Russia 1667 Wiesław Kosek (WK)Space Research Centre, PAS, Warsaw, Poland1782 Xu Xueqing (XX)Shanghai Astronomical Observatory, China1532 Zinovy Malkin (ZM) Pulkovo Observatory, Russia")
8
EOPCPPP (from 2010) RESULTS An example of 90-day polar motion predictions at different starting prediction epochs from different participants of the EOPCPPP
 RESULTS An example of 90-day polar motion predictions at different starting prediction epochs from different participants of the EOPCPPP")
9
Standard deviation (SDE) Mean absolute error (MAE)
 Mean absolute error (MAE)")
10
Skewness (SKE) skewness is a measure of the asymmetry of the probability distribution of a real- valued random variable. Negative skew indicates that the tail on the left side of the probability density function is longer than the right side. If the distribution is symmetric then skewness is zero. - third moment about the mean - standard deviation error - the expectation operator.

11
Kurtosis (CUR) (Gr. κυρτός, ang. bulging) is a measure of the "peakedness" of the probability distribution of a real-valued random variable, - fourth moment about the mean - standard deviation error - the expectation operator.
 is a measure of the peakedness of the probability distribution of a real-valued random variable, - fourth moment about the mean - standard deviation error - the expectation operator..")
12
Mean absolute error (MAE), standard deviation (SDE), skewness and kurtosis together with their error bars of x (blue), y (red) predictions computed by Brian Luzum.
, standard deviation (SDE), skewness and kurtosis together with their error bars of x (blue), y (red) predictions computed by Brian Luzum.")
13
Mean absolute error (MAE), standard deviation (SDE), skewness and kurtosis together with their error bars of x (blue), y (red) predictions computed by Valery Tissen.
, standard deviation (SDE), skewness and kurtosis together with their error bars of x (blue), y (red) predictions computed by Valery Tissen.")
14
Mean absolute error (MAE), standard deviation (SDE), skewness and kurtosis together with their error bars of x (blue), y (red) predictions computed by Zinovy Malkin.
, standard deviation (SDE), skewness and kurtosis together with their error bars of x (blue), y (red) predictions computed by Zinovy Malkin.")
15
Mean absolute error (MAE), standard deviation (SDE), skewness and kurtosis together with their error bars of x (blue), y (red) predictions computed by Wieslaw Kosek.
, standard deviation (SDE), skewness and kurtosis together with their error bars of x (blue), y (red) predictions computed by Wieslaw Kosek.")
16
Mean absolute error (MAE), standard deviation (SDE), skewness and kurtosis together with their error bars of x (blue), y (red) predictions computed by Maciej Kalarus.
, standard deviation (SDE), skewness and kurtosis together with their error bars of x (blue), y (red) predictions computed by Maciej Kalarus.")
17
Absolute values of the differences between the IERS x, y pole coordinates data and their LS+AR predictions and the SDE, MAE, SKE and KUR of these differences in 1986.5 - 2015.5

18
LS+AR prediction errors of IERS x, y pole coordinates data and of x, y pole coordinates model data computed from AAM+OAM and AAM excitation functions - pole coordinates model data, - equatorial fluid excitation functions (AAM, OAM), - complex-valued Chandler frequency, where and is the quality factor
, - complex-valued Chandler frequency, where and is the quality factor")
19
EOPPCC The differences between the IERS x,y pole coordinates data and their LS+AR 90-day predictions and time series of these differences for one (purple) and two (green) weeks in the future. EOPCPPP Cor_coef=0.595 ± 0.022 Cor_coef=0.549 ± 0.022

20
The mean FTBPF amplitude spectra (λ=0.0003) of the differences between the IERS x-iy pole coordinates data and their LS+AR predictions at 1, 2 and 4 weeks in the future
 of the differences between the IERS x-iy pole coordinates data and their LS+AR predictions at 1, 2 and 4 weeks in the future")
21
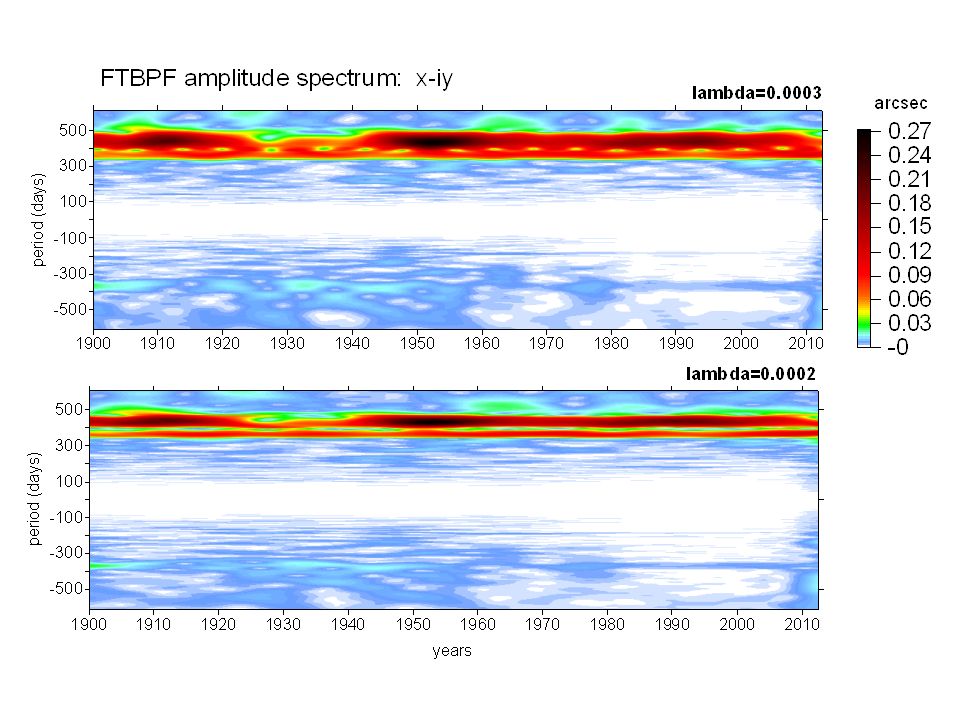
Time variable FTBPF amplitude spectra (λ=0.001) of the differences between the IERS x-iy pole coordinates data and their LS+AR predictions at 1, 2 and 4 weeks in the future
 of the differences between the IERS x-iy pole coordinates data and their LS+AR predictions at 1, 2 and 4 weeks in the future")
22
Combination of complex demodulation and the Fourier transform low pass filter (CD+FTLPF) 1. Multiplication of the time series by complex-valued harmonic with frequency : 2. Filtration of the transformed signal using FTLPF of complex-valued time series: 3. Computation of instantaneous phases:. - transmittance function, λ - window halfwidth

23
Amplitudes and phases of the Chandler (green) and Annual (x-blue, y-red) oscillations computed by combination of complex demodulation and the Fourier transform low pass filter (CD+FTLPF)
 and Annual (x-blue, y-red) oscillations computed by combination of complex demodulation and the Fourier transform low pass filter (CD+FTLPF)")
24
First differences of amplitudes (x-red, y-orange) and the products of amplitudes and phase differences (x-navy blue, y-blue) of the Chandler, annual and semi-annual oscillations computed by the CD+FTLPF combination.
 and the products of amplitudes and phase differences (x-navy blue, y-blue) of the Chandler, annual and semi-annual oscillations computed by the CD+FTLPF combination.")
25
The pole coordinates data mean prediction errors for different participants of the EOPCPPP are different due to different prediction techniques applied as well as different time span of data to compute them. The skewness and kurtosic values of the differences between pole coordinates data and their predictions for different prediction lengths and for different participants of the EOPCPPP are close to 0 and 3 for, respectively which means that they follow normal distribution. The increase of the differences between pole coordinates data and their prediction with the prediction length is caused by mismodelling of the irregular Chandler and annual oscillations in the forecast models. CONCLUSIONS

26
IERS Rapid Service/Prediction Centre Wyznaczaniem prognoz EOP zajmuje się IERS RS/PC w US Naval Observatory w Waszyngtonie: -UT1-UTC prognozowany jest z wykorzystaniem prognozy składowej osiowej momentu pędu atmosfery (Johnson et al., 2005) otrzymywanej w procesie dynamicznego wyznaczenia modelu cyrkulacji atmosfery. -współrzędne x, y bieguna prognozowane są kombinacją metody najmniejszych kwadratów i autoregresji (LS+AR) (Kosek i in., 2004). -obecna dokładność modelu precesji-nutacji IAU 2006/2000A jest bardzo wysoka dlatego residua precesji-nutacji dX, dY pokazują jedynie niedeterministyczny sygnał z okresem ok. 430 dni i o amplitudzie rzędu 0.3 mas pochodzący od rotacji ciekłego jądra Ziemi. Prognoza precesji i nutacji wyznaczana jest jako ekstrapolacja modelu IAU 2006/2000A.
 (Kosek i in., 2004). -obecna dokładność modelu precesji-nutacji IAU 2006/2000A jest bardzo wysoka dlatego residua precesji-nutacji dX, dY pokazują jedynie niedeterministyczny sygnał z okresem ok. 430 dni i o amplitudzie rzędu 0.3 mas pochodzący od rotacji ciekłego jądra Ziemi. Prognoza precesji i nutacji wyznaczana jest jako ekstrapolacja modelu IAU 2006/2000A..")
27
PROGNOZOWANIE ZMIAN EOP W celu uzyskania informacji o pozycji obiektu znajdującego się poza rotującą Ziemią należy wiedzieć jak mają się do siebie współrzędne stacji obserwacyjnej określone w układzie ziemskim względem współrzędnych tego obiektu określonych w układzie niebieskim. Obserwacje technikami: VLBI, SLR, GNSS, DORIS pozwalają obecnie na wyznaczanie układów niebieskiego i ziemskiego z wysoką dokładnością, jednak nie pozwalają na wyznaczenie parametrów orientacji Ziemi w czasie rzeczywistym. Nawiązanie układów w czasie rzeczywistym jest możliwe dzięki prognozom parametrów orientacji Ziemi (x, y, UT1-UTC, dX, dY). Prognozy EOP wykorzystywane są między innymi przez NASA Deep Space Network (DSN), która jest siecią anten służących do kontroli:Prognozy EOP wykorzystywane są między innymi przez NASA Deep Space Network (DSN), która jest siecią anten służących do kontroli: - misji międzyplanetarnych, - misji międzyplanetarnych (Cassini, Opportunity, Spirit, Mars Global Serveyor, Rosetta, Stardust, Voyager-1, Voyager-2)., - radiowych i radarowych obserwacji astronomicznych, - radiowych i radarowych obserwacji astronomicznych, - niektórych okołoziemskich misji kosmicznych. - niektórych okołoziemskich misji kosmicznych. DSN jako największy i najlepiej wyposażonym systemem telekomunikacyjny na świecie składa się z trzech kompleksów komunikacyjnych DSN jako największy i najlepiej wyposażonym systemem telekomunikacyjny na świecie składa się z trzech kompleksów komunikacyjnych - Goldstone, California, pustynia Mojave; - Goldstone, California, pustynia Mojave; - Madrid, Spain; - Madrid, Spain; - Canberra, Australia. - Canberra, Australia.
. Prognozy EOP wykorzystywane są między innymi przez NASA Deep Space Network (DSN), która jest siecią anten służących do kontroli:Prognozy EOP wykorzystywane są między innymi przez NASA Deep Space Network (DSN), która jest siecią anten służących do kontroli: - misji międzyplanetarnych, - misji międzyplanetarnych (Cassini, Opportunity, Spirit, Mars Global Serveyor, Rosetta, Stardust, Voyager-1, Voyager-2)., - radiowych i radarowych obserwacji astronomicznych, - radiowych i radarowych obserwacji astronomicznych, - niektórych okołoziemskich misji kosmicznych. - niektórych okołoziemskich misji kosmicznych. DSN jako największy i najlepiej wyposażonym systemem telekomunikacyjny na świecie składa się z trzech kompleksów komunikacyjnych DSN jako największy i najlepiej wyposażonym systemem telekomunikacyjny na świecie składa się z trzech kompleksów komunikacyjnych - Goldstone, California, pustynia Mojave; - Goldstone, California, pustynia Mojave; - Madrid, Spain; - Madrid, Spain; - Canberra, Australia. - Canberra, Australia..")
29
The mean LS+AR prediction errors of IERS x, y pole coordinates data (black), and of x, y pole coordinates model data computed from AAM+OAM (red) excitation functions as well as by summing the DWTBPF components corresponding to Chandler, annual and shorter period oscillations (green)
, and of x, y pole coordinates model data computed from AAM+OAM (red) excitation functions as well as by summing the DWTBPF components corresponding to Chandler, annual and shorter period oscillations (green)")
Podobne prezentacje


klasyczne>")
>")


 Poznan University of Life Sciences Department of Hydraulic and Sanitary Engineering Hamdi, Schiesser & Griffiths:>")