Pobierz prezentację
Pobieranie prezentacji. Proszę czekać

1
Model biometryczny sędziego piłki nożnej
Akademia Wychowania Fizycznego w Katowicach Model biometryczny sędziego piłki nożnej This sample presentation will illustrate the Power of PowerDESIGNS. We start off by selecting a background template from the PowerTEMPLATES collection. dr Przemysław Pietraszewski

2
REFEREE INDEX „RI”

3
Większość czynników nieznana
AKTUALNY STAN WIEDZY 25% modelu Many creative diagrams like this sphere are included in the PowerGRAPHICS library. Większość czynników nieznana

4
PROCEDURA MODELOWANIA
Wybór zmiennych Weryfikacja zmiennych Dobór do modelu

5
FIFA UEFA EKSTRAKLASA G/A
MATERIAŁ BADAWCZY FIFA UEFA EKSTRAKLASA G/A POZIOM I I LIGA G/A POZIOM II II LIGA POZIOM III III LIGA POZIOM IV

6
Sędziowie i Sędziny 3d PowerGRAPHICS are an exciting way to illustrate key concepts and keep your audience entertained

7
Parametry specjalne sędziowania
BADANE PARAMETRY Parametry specjalne sędziowania Inne Motoryka ? Fizjologia Psychologia Here, PowerGraphics are used in conjunction with PowerICONS to create an interactive graphic Somatyka

8
PSYCHOLOGIA CECHY Reakcja na stres Lęk Percepcja Inteligencja
Temperament Osobowość Percepcja Inteligencja emocjonalna Lęk Reakcja na stres PROFIL SmartArt custom animation effects: bending process (Intermediate) To reproduce the SmartArt effects on this slide, do the following: On the Home tab, in the Slides group, click Layout, and then click Blank. On the Insert tab, in the Illustrations group, click SmartArt. In the Choose a SmartArt Graphic dialog box, in the left pane, click Process. In the Process pane, click Vertical Bending Process (fifth row, third option from the left), and then click OK to insert the graphic into the slide. Select the graphic, and then click one of the arrows on the left border. In the Type your text here dialog box, enter text. On the slide, select the graphic. Under SmartArt Tools, on the Design tab, in the SmartArt Styles group, do the following: Click Change Colors, and then under Accent 1 click Colored Fill – Accent 1 (second option from the left). Click More, and then under 3-D click Polished (first option from the left). On the Home tab, in the Font group, select Gill Sans MT from the Font list, and then select 24 from the Font Size list. Select the top left shape (starting point) in the graphic, and then do the following: Under SmartArt Tools, on the Format tab, in the Shape Styles group, click the arrow next to Shape Fill, and then under Theme Colors click Olive Green, Accent 3, Darker 25% (fifth row, seventh option from the left). Under SmartArt Tools, on the Format tab, in the Shapes group, click Change Shape, and then under Flowchart click Off-page Connector (second row, second option from the left). Select the bottom right shape (ending point) in the graphic, and then do the following: Under SmartArt Tools, on the Format tab, in the Shape Styles group, click the arrow next to Shape Fill, and then under Theme Colors click Red, Accent 2, Darker 25% (fifth row, sixth option from the left). Under SmartArt Tools, on the Format tab, in the Shapes group, click Change Shape, and then under Basic Shapes click Hexagon (first row, eighth option from the left). To reproduce the animation effects on this slide, do the following: On the Animations tab, in the Animations group, click Custom Animation. On the slide, select the graphic. In the Custom Animation task pane, do the following: Click Add Effect, point to Entrance, and then click More Effects. In the Add Entrance Effect dialog box, under Subtle, click Fade. Under Modify: Fade, in the Speed list, select Fast. Also in the Custom Animation task pane, select the fade effect. Click the arrow to the right of the fade effect, and then click Effect Options. In the Fade dialog box, on the SmartArt Animation tab, in the Group graphic list, select One by one, and then click OK. Also in the Custom Animation task pane, click the double arrow under the fade effect to expand the contents of the list of effects, and then do the following: Press and hold CTRL, select the first, third, fifth, seventh, ninth, 11th, 13th, 15th, and 17th animation effects (fade effects for the rectangles), and then do the following: Click Change, point to Entrance, and then click More Effects. In the Change Entrance Effect dialog box, under Moderate, click Stretch. Under Modify: Stretch, in the Start list, select With Previous. Under Modify: Stretch, in the Speed list, select Fast. Press and hold CTRL, and then select the first, third, fifth, 15th, and 17th animation effects (stretch effects for the first, second, third, eighth, and ninth rectangles in the path). Under Modify: Stretch, in the Direction list, select From Top. Press and hold CTRL, and then select the seventh and 13th animation effects (stretch effects for the fourth and seventh rectangles in the path). Under Modify: Stretch, in the Direction list, select From Left. Press and hold CTRL, and then select the ninth and 11th animation effects (stretch effects for the fifth and sixth rectangles in the path). Under Modify: Stretch, in the Direction list, select From Bottom. Press and hold CTRL, and then select the second, fourth, sixth, eighth, 10th, 12th, 14th, and 16th animation effects (fade effects for the connectors). Under Modify: Fade, in the Start list, select After Previous. Select the eighth animation effect (fade effect for the connector between the fourth and fifth rectangle). Click the arrow to the right of the eighth animation effect, and then click Timing. In the Fade dialog box, on the Timing tab, in the Delay box, enter 0.5, and then click OK. Select the 10th animation effect (fade effect for the connector between the fifth and sixth rectangle). Click the arrow to the right of the 10th animation effect, and then click Timing. In the Fade dialog box, on the Timing tab, in the Delay box, enter 0.5. To reproduce the background effects on this slide, do the following: Right-click the slide background area, and then click Format Background. In the Format Background dialog box, click Fill in the left pane, select Gradient fill in the Fill pane, and then do the following: In the Type list, select Linear. In the Direction list, click Linear Down (first row, second option from the left). Under Gradient stops, click Add or Remove until two stops appear in the drop-down list. Also under Gradient stops, customize the gradient stops that you added as follows: Select Stop 1 from the list, and then do the following: In the Stop position box, enter 0%. Click the button next to Color, and then under Theme Colors click Blue, Accent 1, Darker 25% (fifth row, fifth option from the left). Select Stop 2 from the list, and then do the following: In the Stop position box, enter 71%. Click the button next to Color, and then under Theme Colors click Black, Text 1 (first row, second option from the left).
 To reproduce the SmartArt effects on this slide, do the following: On the Home tab, in the Slides group, click Layout, and then click Blank. On the Insert tab, in the Illustrations group, click SmartArt. In the Choose a SmartArt Graphic dialog box, in the left pane, click Process. In the Process pane, click Vertical Bending Process (fifth row, third option from the left), and then click OK to insert the graphic into the slide. Select the graphic, and then click one of the arrows on the left border. In the Type your text here dialog box, enter text. On the slide, select the graphic. Under SmartArt Tools, on the Design tab, in the SmartArt Styles group, do the following: Click Change Colors, and then under Accent 1 click Colored Fill – Accent 1 (second option from the left). Click More, and then under 3-D click Polished (first option from the left). On the Home tab, in the Font group, select Gill Sans MT from the Font list, and then select 24 from the Font Size list. Select the top left shape (starting point) in the graphic, and then do the following: Under SmartArt Tools, on the Format tab, in the Shape Styles group, click the arrow next to Shape Fill, and then under Theme Colors click Olive Green, Accent 3, Darker 25% (fifth row, seventh option from the left). Under SmartArt Tools, on the Format tab, in the Shapes group, click Change Shape, and then under Flowchart click Off-page Connector (second row, second option from the left). Select the bottom right shape (ending point) in the graphic, and then do the following: Under SmartArt Tools, on the Format tab, in the Shape Styles group, click the arrow next to Shape Fill, and then under Theme Colors click Red, Accent 2, Darker 25% (fifth row, sixth option from the left). Under SmartArt Tools, on the Format tab, in the Shapes group, click Change Shape, and then under Basic Shapes click Hexagon (first row, eighth option from the left). To reproduce the animation effects on this slide, do the following: On the Animations tab, in the Animations group, click Custom Animation. On the slide, select the graphic. In the Custom Animation task pane, do the following: Click Add Effect, point to Entrance, and then click More Effects. In the Add Entrance Effect dialog box, under Subtle, click Fade. Under Modify: Fade, in the Speed list, select Fast. Also in the Custom Animation task pane, select the fade effect. Click the arrow to the right of the fade effect, and then click Effect Options. In the Fade dialog box, on the SmartArt Animation tab, in the Group graphic list, select One by one, and then click OK. Also in the Custom Animation task pane, click the double arrow under the fade effect to expand the contents of the list of effects, and then do the following: Press and hold CTRL, select the first, third, fifth, seventh, ninth, 11th, 13th, 15th, and 17th animation effects (fade effects for the rectangles), and then do the following: Click Change, point to Entrance, and then click More Effects. In the Change Entrance Effect dialog box, under Moderate, click Stretch. Under Modify: Stretch, in the Start list, select With Previous. Under Modify: Stretch, in the Speed list, select Fast. Press and hold CTRL, and then select the first, third, fifth, 15th, and 17th animation effects (stretch effects for the first, second, third, eighth, and ninth rectangles in the path). Under Modify: Stretch, in the Direction list, select From Top. Press and hold CTRL, and then select the seventh and 13th animation effects (stretch effects for the fourth and seventh rectangles in the path). Under Modify: Stretch, in the Direction list, select From Left. Press and hold CTRL, and then select the ninth and 11th animation effects (stretch effects for the fifth and sixth rectangles in the path). Under Modify: Stretch, in the Direction list, select From Bottom. Press and hold CTRL, and then select the second, fourth, sixth, eighth, 10th, 12th, 14th, and 16th animation effects (fade effects for the connectors). Under Modify: Fade, in the Start list, select After Previous. Select the eighth animation effect (fade effect for the connector between the fourth and fifth rectangle). Click the arrow to the right of the eighth animation effect, and then click Timing. In the Fade dialog box, on the Timing tab, in the Delay box, enter 0.5, and then click OK. Select the 10th animation effect (fade effect for the connector between the fifth and sixth rectangle). Click the arrow to the right of the 10th animation effect, and then click Timing. In the Fade dialog box, on the Timing tab, in the Delay box, enter 0.5. To reproduce the background effects on this slide, do the following: Right-click the slide background area, and then click Format Background. In the Format Background dialog box, click Fill in the left pane, select Gradient fill in the Fill pane, and then do the following: In the Type list, select Linear. In the Direction list, click Linear Down (first row, second option from the left). Under Gradient stops, click Add or Remove until two stops appear in the drop-down list. Also under Gradient stops, customize the gradient stops that you added as follows: Select Stop 1 from the list, and then do the following: In the Stop position box, enter 0%. Click the button next to Color, and then under Theme Colors click Blue, Accent 1, Darker 25% (fifth row, fifth option from the left). Select Stop 2 from the list, and then do the following: In the Stop position box, enter 71%. Click the button next to Color, and then under Theme Colors click Black, Text 1 (first row, second option from the left).")
9
Parametry meczowe Trajektoria Dystans Energetyka wysiłku
Prędkość średnia Prędkość maksymalna Tętno aktualne Tętno maksymalne Tętno średnie Strefy tętna Średnie tempo Etc. This PowerICON is used to add imagery and impact.

10
ANALIZA RUCHU PODCZAS GRY
This PowerICON is used to add imagery and impact.

11
ANALIZA RUCHU PODCZAS GRY
This PowerICON is used to add imagery and impact.

12
ANALIZA RUCHU PODCZAS GRY
This PowerICON is used to add imagery and impact.

13
ŚWIATOWE OŚRODKI BADAWCZE
Teesside University University of Madrit Trakya University Roma University Berliner University

14
WYNIKI ŚWIATOWYCH BADAŃ
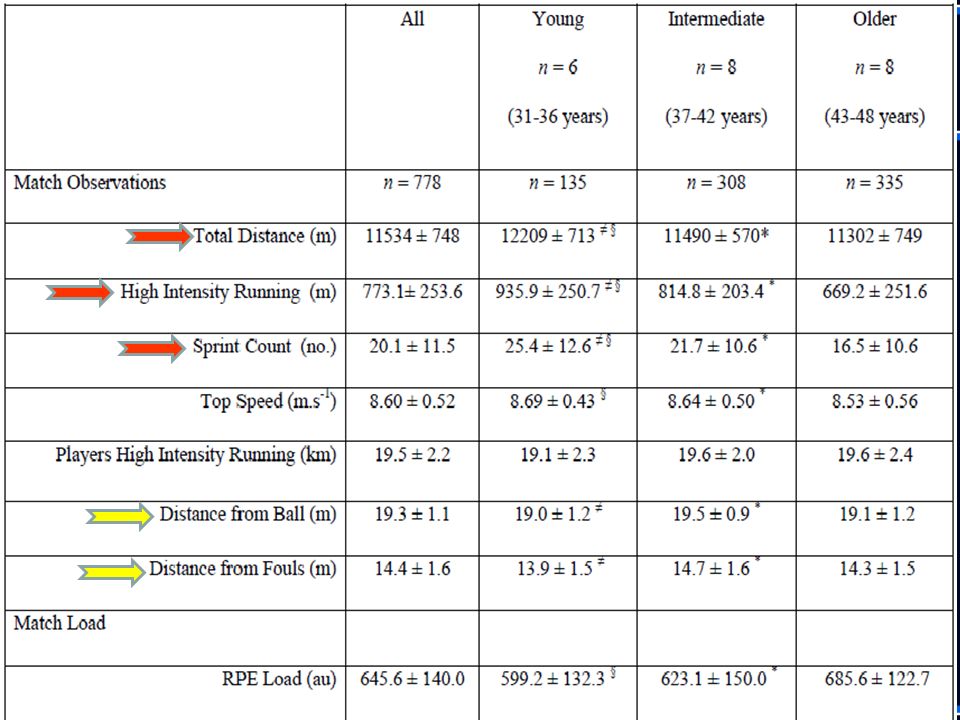
WPŁYW WIEKU NA EFEKTYWNOŚĆ SĘDZIOWANIA 22 sędziów Premier League 31 – 48 lat 4 lata, 778 obserwacji, PRO ZONE

15
WYNIKI ŚWIATOWYCH BADAŃ
WPŁYW WIEKU NA EFEKTYWNOŚĆ SĘDZIOWANIA TD – pokonany dystans HIR – bieg z dużą intensywnością 5,5m/s 19,8km/h an SC – sprinty 7m/s 25km/h TS – najwyższa prędkość DB – średnia odległość od piłki DF – średnia odległość od fauli

17
WYNIKI ŚWIATOWYCH BADAŃ
WPŁYW WIEKU NA EFEKTYWNOŚĆ SĘDZIOWANIA HIR – 28% różnicy SC – 35% różnicy TD – 7,4% różnicy Pozostałe nieistotne

18
Dystans - wiek

19
HIR - wiek

20
SC - wiek

21
WYNIKI ŚWIATOWYCH BADAŃ
Intensywność wysiłku sędziego: Premier League 83,6% HRmax Championship League 80,8% Hrmax Średni pokonany dystans w meczu: 11,5km Średnia ilość decyzji w meczu: 78

22
BADANIA ASYSTENCI Intensywność wysiłku sędziego FIFA: 78,3% HRmax
Średni pokonany dystans w meczu: 5,8 – 6,9km Krok odstawno – dostawny: 30% dystansu 16-20% dystansu z wysoką intensywnością >13km/h Styl poruszania się: standing still <3,6km/h: 48% walking 3,61-7,2km/h: 24% jogging 7,21-13km/h: 16% cruising 13,1-18km/h: 7,1% high speed running >18km/h : 4,9% Średnia odległość od linii spalonego: 0,64m

23
WYNIKI ŚWIATOWYCH BADAŃ
Zgodność interpretacji 60 sytuacji z WC2002 4 panele oceniały (faul, G, +, ++) wyniki wymusiły ujednolicenie wytycznych
 wyniki wymusiły ujednolicenie wytycznych.")
Podobne prezentacje


 zmiennej>")
 Na podstawie prezentacji László HERPAIA członka komisji sędziowskiej FIVB opracował Mirosław.>")


